SSR Inst. Int. J. Life Sci., 10(1): 3632-3641, Jan 2024
Analysis
between Serum Correlation of Procalcitonin and C-reactive Protein in Patients
with Sepsis: An Observational Study
1Senior Resident, Dept. of Medicine, SLN Medical College, Koraput, Odisha,
India
2Assistant Professor, Dept. of Medicine, SCB Medical College &
Hospital, Cuttack, Odisha, India
3Project Coordinator, Centre for Community Medicine, AIIMS, New Delhi,
India
4Associate Professor, Dept. of Medicine, Jagannath Medical College, Puri,
Odisha, India
5Professor, Dept. of Medicine, SCB Medical College & Hospital,
Cuttack, Odisha, India
6Joint DMET, Government of Odisha, Bhubaneswar, India
7Assistant Professor, Dept. of Radiation Oncology,
VIMSAR, Odisha, India
*Address for Correspondence: Dr. Suresh Kumar Rout, Assistant Professor, Dept. of
Radiation Oncology, VIMSAR, Odisha, India
E-mail: sureshrout98@gmail.com
ABSTRACT-
Background: Physiological
measures of malfunction in six organ systems (respiratory, cardiovascular,
hepatic, coagulation, renal, and central nervous systems) were used to create
the sequential organ failure assessment (SOFA) score. Each organ system is
graded from 0 to 4 with increasing severity of dysfunction. Procalcitonin (PCT)
and C-reactive protein (CRP) are recognised indicators of sepsis. Procalcitonin
and C-reactive protein serum concentrations should be compared and correlated
with the various degrees of organ dysfunction in the sepsis.
Methods: A total number of 75 patients admitted to ICU
were selected for
this
study. Routine investigations
like CBC, LFT, RFT, arterial blood gas analysis and
Special investigations like Serum
Procalcitonin and serum CRP were done
in all patients. Based on the SOFA score, four groups of patients
were chosen for the study, each with varying degrees of organ dysfunction in
sepsis.
Results: In the study,
58.6% were males.
About
60% of patients were above 50 years of age. In the study, the most common presentation in mild and
severe sepsis was fever. The mean serum PCT levels
were found to be significantly higher among patients with severe sepsis, i.e.
46.6±37
mg/mL, as compared to mild sepsis patients i.e.17.3±22.7 mg/mL with p-value of
0.001. The mean CRP value was found to be non-significantly lower among
patients with severe sepsis.
Conclusion: The degree of infection is
highly correlated with PCT and SOFA. Because PCT levels closely correlate with
the severity of sepsis and its outcome, PCT has a greater capacity for
diagnosis than CRP.
Key words: Correlation of procalcitonin (PCT), Sepsis-related
organ failure assessment (SOFA), C-reactive protein (CRP), Organ dysfunction, Sepsis
INTRODUCTION- In 2016, a third
worldwide consensus definition of sepsis was released, which was described as
"a dysregulated host response to infection resulting in life-threatening
organ dysfunction." The sepsis-related organ failure assessment (SOFA)
score and the use of "quick" SOFA for patients with suspected sepsis
outside of the intensive care unit (ICU) are used by the consensus definition
in place of the SIRS criteria [1,2]. PCT is a protein precursor with
a molecular weight of about 13 kDa that is related to the hormone calcitonin.
PCT has been induced in the plasma of patients suffering from severe bacterial,
fungal, or septic diseases. PCT concentrations can exceed 1000 ng/ml in
situations of septic shock and severe sepsis. PCT is not brought on by viruses,
autoimmune conditions, or localised bacterial infections [3].
Whether
PCT is primarily impacted by the strength of the systemic inflammatory response
or by inflammation brought on by microbial infections is still up for debate.
The connection between PCT concentrations and multiorgan dysfunction
independent to sepsis origin has not received much attention [4-6].
The majority of current research has focused on sepsis severity scores, such as
the ACCP/SCCM criteria or values that are comparable. It is not always possible
to assess whether a major infection is present in critically sick patients
presenting indications of septic shock or systemic inflammation; for example,
the number of positive bacterial cultures can increase as the disease develops [7,8].
Thus, in order to better understand the relationship between PCT concentrations
and the degree of organ dysfunction in patients with multiple organ dysfunction
syndrome (MODS) brought on by systemic inflammation, whether infectious or not,
we looked at the sepsis-related organ failure assessment (SOFA) score [9].
Three criteria are included in the Quick SOFA clinical score, which is a
straightforward bedside score.
·
Alteration in mental status.
·
Systolic blood pressure ≤100 mmHg.
·
Respiratory rate ≥22 per min.
Each is given a score
of 1. Score≥2 means poor outcomes.
Sequential organ failure assessment (SOFA) score was constructed using physiological measures of dysfunction in six organ systems (respiratory, cardiovascular, liver, coagulation, renal and central nervous
systems), each of which is graded from 0 to 4 with increasing
severity of dysfunction [10]. The adoption of the SOFA score means
that identifying septic patients can now be easier and faster without the requirements of laboratory investigation.[3,4] PCT is a
precursor protein of the hormone calcitonin with a molecular weight of
approximately 13 kDa. PCT is induced in the plasma of patients with severe
bacterial or fungal infections or sepsis. [5,6] Both CRP and PCT are
accepted sepsis markers. But there is still some debate concerning the correlation between their serum concentrations and sepsis severity.
Thus, analysis of serum concentrations of CRP and PCT in varied
severity of organ dysfunction in sepsis as assessed
by SOFA scores is being done [11].
MATERIAL AND
METHODS
SOFA score assesses
organ dysfunction in critically ill patients, notably in intensive care units in Table
1.
This score system includes respiratory, coagulation, hepatic, cardiovascular,
CNS, and renal physiological characteristics. The degree of dysfunction in each
organ system is scored from 0 to 4, with higher scores indicating more severe
damage. In the respiratory component, PaO2/FIO2 is the ratio of arterial oxygen
partial pressure to inspired oxygen. platelet count, liver function by
bilirubin, cardiovascular condition by MAP and vasopressor needs, CNS function
by Glasgow Coma Scale (GCS) score, and renal function by serum creatinine and
urine output. The cumulative SOFA score aids healthcare workers in assessing
organ dysfunction and making prognostication and management decisions for
critically unwell patients.
Table 1: SOFA score
|
System |
0 |
1 |
2 |
3 |
4 |
|
Respiration PaO2/FIO2 mm Hg (kPa) |
≥ 400 (53.3) |
<400 (53.3) |
<300 (40) |
<200 (26.7) With respiratory support |
<100 (13.3) With respiratory support |
|
Coagulation Platelets *102/ul |
≥150 |
<150 |
<100 |
<50 |
<20 |
|
Liver Bilirubin mg/dl (umol/L) |
<1.2 (20) |
1.2-1.9 (20-32) |
2-5.9 (33-101) |
6-11.9 (102-204) |
>12 (204) |
|
Cardiovascular |
MAP ≥70 mmHg |
MAP <70 mmHg |
Dopamine <5 or Dobutamine (any dose) |
Dopamine 5.1-15 or Epinephrine ≤0.1
or Norepinephrine
≤
0.1 |
Dopamine .15 or Epinephrine .0.1 or Norepinephrine .0.1 |
|
CNS GCS Score |
15 |
13-14 |
10-12 |
6-9 |
<6 |
|
Renai Creathinine, mg/dl (umol/L) Urine Output, ml/d |
<1.2(110) |
1.2-1.9 (110-170) |
2-3.4 (171-299) |
3.5-4.9 (300-440) <500 |
0.5 (440) <200 |
Serum PCT [by
ECLIA, Cobas E411(Roche)] immune fluorescent assay (Germany) and
CRP (Using SIEMENS) concentrations were estimated in all the patients.
Inclusion and Exclusion Criteria
Inclusion
ü To qualify for participation, patients were required
to be at least 15 years old and hospitalized in the intensive care unit (ICU)
with a preliminary diagnosis of sepsis.
ü A complete blood count (CBC), liver function tests
(LFT), renal function tests (RFT), arterial blood gas (ABG) analysis, and
special investigations
ü In addition, serum procalcitonin and serum CRP were
performed on every patient. Routine investigations were also performed when
necessary.
Exclusion
ü Patients under the age of 15 were not allowed to
participate in the study.
ü Furthermore, patients who developed sepsis because of
post-operative or post-traumatic situations were excluded from the study.
ü The purpose of this exclusion criterion was to ensure
uniformity in the study population by specifically selecting patients with
sepsis that was not caused by surgery or trauma.
Statistical Analysis- Data were entered in
MS-Excel and analyzed in SPSS V25. Descriptive statistics of SOFA score, PCT concentration, CRP
concentration was analyzed. These are represented with percentages, mean with SD or Median with IQR depending
on the nature of the data. Shapiro-wilk test was applied to find normality. Chi-square test Fisher Exact test was applied to find significance in proportions. Independent T-test, and Mann-Whitney U test were applied to compare mean and median values between
two groups (mild and severe sepsis) respectively. ROC
curve was drawn. Area under the curve was calculated. Sensitivity and specificity were calculated and p<0.05
was considered statistically significant.
RESULTS
Table 2 shows the severity of Sequential Organ Failure Assessment (SOFA) scores
for patients by age group. The age groupings are 18-30, 31-40, 41-50, 51-60,
61-70, and above 70. The table shows how many patients have "Mild" or
"Severe" SOFA scores for each age group. The 18-30 age group scores
11 and the 31-40 age group scores 9, reflecting 16.9% and 13.8% of their age
categories, respectively, in the "Mild" category. The
"Severe" category has particular scores with percentages. The
severity percentages rise with age, reaching 50% in the 61-70 age group. The
overall distribution shows SOFA score variance across age groups, revealing the
incidence of different organ failure levels in the examined patient population.
Table 2: Distribution of patients
based on severity
of SOFA score
|
Age (years) |
SOFA Score |
|||
|
Mild |
Severe |
|||
|
Number |
|
Number |
% |
|
|
18-30 |
11 |
16.9 |
0 |
0 |
|
31-40 |
9 |
13.8 |
1 |
10 |
|
41-50 |
11 |
16.9 |
0 |
0 |
|
51-60 |
14 |
21.5 |
3 |
30 |
|
61-70 |
12 |
18.5 |
5 |
50 |
|
>70 |
8 |
12.3 |
1 |
10 |
|
Total |
65 |
100 |
10 |
100 |
p=0.18
Table 3 describes the severity of sepsis
among male and female patients. A higher proportion of males i.e. 39
(60%), were suffering from mild sepsis.
In contrast, an equal
proportion of both genders were suffering from
severe sepsis i.e. 05 in each group, but these results were not statistically significant.
Table 3: Severity of sepsis across both the sexes
|
Sex |
SOFA |
|||
|
Mild |
Severe |
|||
|
Number |
% |
Number |
% |
|
|
Male |
39 |
60 |
5 |
50 |
|
Female |
26 |
40 |
5 |
50 |
|
Total |
65 |
100 |
10 |
100 |
p=0.73
Table 4 shows the clinical presentation of
sepsis patients admitted to the ICU. All
the patients with mild and severe sepsis had
fever. The next most common presentation of patients with mild sepsis was chills/rigor i.e. 50 (76.9%)
followed by cough
i.e. 29 (44.6%), expectoration i.e. 26 (40%) and
myalgia i.e 24 (36.9%). Among the patients with
severe sepsis, following fever, the next most common presentations were chills/rigour i.e. 09 (90%). Equal
proportion of patients were having myalgia, cough,
vomiting and abdominal pain i.e. 04 (40%) each. However, none of these findings
were statistically significant.
Table 4: Clinical presentation of patients based on severity
of sepsis
|
|
SOFA |
p-value |
|||
| Mild |
Severe |
||||
|
Number |
% |
Number |
% |
||
|
Fever |
65 |
100 |
10 |
100 |
1 |
|
Chills/Rigor |
50 |
76.9 |
9 |
90 |
0.68 |
|
Myalgia |
24 |
36.9 |
4 |
40 |
1 |
|
Arthralgia |
1 |
1.5 |
1 |
10 |
0.25 |
|
Bleeding |
1 |
1.6 |
0 |
0 |
1 |
|
Cough |
29 |
44.6 |
4 |
40 |
1 |
|
Expectoration |
26 |
40 |
1 |
10 |
0.08 |
|
Cold/Rhinorrhoea |
1 |
1.5 |
0 |
0 |
1 |
|
Dyspnea |
20 |
30.8 |
3 |
30 |
1 |
|
Chest pain |
1 |
1.5 |
0 |
0 |
1 |
|
Vomiting |
19 |
29.2 |
4 |
40 |
0.48 |
|
Loose stool |
12 |
18.5 |
1 |
10 |
1 |
|
Pain abdomen |
17 |
26.2 |
4 |
40 |
0.45 |
|
Jaundice |
8 |
12.3 |
0 |
0 |
0.59 |
|
Dysuria |
7 |
10.8 |
3 |
30 |
0.12 |
|
Headache |
5 |
7.7 |
2 |
20 |
0.23 |
|
Altered Sensorium |
6 |
9.2 |
3 |
30 |
0.09 |
Table 5 describes the various clinical
findings among patients suffering from mild
and severe sepsis. Among the patients suffering from mild sepsis, the commonest clinical fining was pallor
i.e. 13 (20%), followed by cyanosis i.e. 05 (7.7%) and icterus
i.e. 04 (6.2%), while among patients with severe sepsis, the most common finding was
icterus i.e. 04 (10.7%) followed by pallor with icterus i.e. 02 (6.7%).
Table 5: General physical examination of sepsis patients
|
GPE |
SOFA |
|||
|
Mild |
Severe |
|||
|
Number |
% |
Number |
% |
|
|
Asymptomatic |
25 |
38.5 |
2 |
20 |
|
Pallor |
13 |
20 |
0 |
0 |
|
Pallor and
icterus |
3 |
4.6 |
2 |
20 |
|
Pallor and dehydration |
3 |
4.6 |
0 |
0 |
|
Pallor and
pedal edema |
1 |
1.5 |
0 |
0 |
|
Pallor and bleeding |
1 |
1.5 |
0 |
0 |
|
Pallor and clubbing |
1 |
1.5 |
0 |
0 |
|
Icterus |
4 |
6.2 |
4 |
40 |
|
Icterus and pedal edema |
1 |
1.5 |
0 |
0 |
|
Dehydration |
2 |
3.1 |
1 |
10 |
|
Pedal edema |
3 |
4.6 |
1 |
10 |
|
Cyanosis |
5 |
7.7 |
0 |
00 |
|
Generalized
Swelling |
3 |
4.6 |
0 |
00 |
|
Total |
65 |
100 |
10 |
100 |
Table
6 shows the mean differences in routine blood and Arterial blood gas parameters among patients based on the
degree of severity of sepsis. The patients with severe sepsis had a significantly lower total platelet
count i.e. 79428.0±35609.4/ dL, than those with mild
sepsis i.e. 171210.2±114077.2/ dL, with p-value
0.004. Upon ABG analysis, it was
observed that patients with severe sepsis
had a significantly lower blood pH value of SD 0.1 in contrast to 0.4 in mild sepsis patients. This finding was
statistically significant, with p-value of 0.016.
Table 6: Routine blood investigations, coagulation profile and ABG analysis
|
Variable |
SOFA |
Minimum |
Maximum |
Mean |
SD |
Median |
IQR |
p- value |
|
Hb |
Mild |
6.5 |
17.4 |
11.3 |
2.4 |
11.6 |
4.2 |
0.62 |
|
Severe |
7.6 |
13.9 |
10.9 |
2.1 |
11.4 |
3.8 |
||
|
TLC |
Mild |
2400 |
46800 |
17175.5 |
7100.9 |
14930 |
6120 |
0.85 |
|
Severe |
12870 |
24570 |
16037 |
3631.9 |
15125 |
3897.5 |
||
|
ESR |
Mild |
4 |
125 |
44.2 |
32 |
34 |
30.5 |
0.46 |
|
Severe |
9 |
52 |
31.9 |
13.5 |
31 |
22.5 |
||
|
TPC |
Mild |
5554 |
452000 |
171210.8 |
114077.2 |
134820 |
182935 |
0.004 |
|
Severe |
20000 |
132540 |
79428 |
35609.4 |
90385 |
54497.5 |
||
|
PT |
Mild |
11.1 |
59.7 |
16.5 |
6.5 |
15.1 |
5.3 |
0.13 |
|
Severe |
12.4 |
26.7 |
17.9 |
4.3 |
17.0 |
6.9 |
||
|
INR |
Mild |
0.9 |
5.6 |
1.4 |
0.6 |
1.3 |
0.3 |
0.82 |
|
Severe |
1 |
1.8 |
1.3 |
0.3 |
1.3 |
0.6 |
||
|
APTT |
Mild |
20.8 |
126 |
33.1 |
16.8 |
28.6 |
11.6 |
0.99 |
|
Severe |
18.6 |
77.9 |
35.6 |
18.4 |
31.6 |
25.0 |
||
|
PH |
Mild |
4.3 |
7.5 |
7.3 |
0.4 |
7.4 |
0.1 |
0.016 |
|
Severe |
7.2 |
7.4 |
7.3 |
0.1 |
7.3 |
0.1 |
||
|
PCO2 |
Mild |
16.9 |
52.3 |
33 |
8.4 |
32.7 |
12.1 |
0.63 |
|
Severe |
17.9 |
44.2 |
31.2 |
8.6 |
32.2 |
13 |
||
|
PO2 |
Mild |
57 |
117 |
81.1 |
10.9 |
81.1 |
14 |
0.38 |
|
Severe |
70.4 |
92.7 |
78.5 |
7.8 |
75.9 |
12.4 |
||
|
Lactate |
Mild |
0.3 |
6.3 |
1.4 |
1.3 |
0.9 |
1 |
0.24 |
|
Severe |
0.7 |
2.3 |
1.3 |
0.5 |
1.2 |
0.7 |
||
|
HCO2 |
Mild |
6.4 |
29.4 |
19.3 |
4.9 |
19.3 |
6.3 |
0.39 |
|
Severe |
6.4 |
26.3 |
17.4 |
5.9 |
18.3 |
9 |
||
|
% SO2C |
Mild |
90.6 |
99.4 |
95.7 |
2.2 |
96 |
3.1 |
0.052 |
|
Severe |
89.7 |
98.6 |
94 |
2.7 |
94.3 |
4 |
||
|
BUN |
Mild |
7.3 |
114.3 |
32.9 |
18.6 |
26 |
17.4 |
0.33 |
|
Severe |
18 |
44.3 |
33.1 |
8.9 |
32.2 |
15.5 |
Table 7 depicts the various types of infections detected among patients
admitted with mild and severe sepsis in the ICU. Pneumonia was the most common infection among patients with
mild sepsis, i.e. 23 (35.4%). The second most
common infection among them was UTI i.e. 10 (15.4%). The most common infection
in patients with severe sepsis is UTI, i.e. 4 (40%). Equal proportion of patients with mild sepsis was suffering
from pyogenic meningitis and diarrhea
along with UTI i.e. 4 (6.2%) each. Each
patient, those with mild sepsis was
found to be suffering from malaria, viral
meningitis, dengue, liver abscess, ARDS, SBP and splenic abscess while none of them with severe sepsis were found to be suffering
from these infections.
Table 7: Common
infections among sepsis patients
|
Infections |
SOFA |
|||
|
Mild |
Severe |
|||
|
No of patients |
% |
No of patients |
% |
|
|
UTI |
10 |
15.4 |
4 |
40 |
|
Pneumonia |
23 |
35.4 |
0 |
0 |
|
Pyogenic meningitis |
4 |
6.2 |
2 |
20 |
|
Malaria |
1 |
1.5 |
0 |
0 |
|
Diarrhea |
5 |
7.7 |
1 |
10 |
|
Viral meningitis |
1 |
1.5 |
0 |
0 |
|
Dengue |
1 |
1.5 |
1 |
10 |
|
Enteric fever |
2 |
3.1 |
0 |
0 |
|
Cellulites |
3 |
4.6 |
0 |
0 |
|
Liver abscess |
1 |
1.5 |
0 |
0 |
|
Scrub typhus |
2 |
3.1 |
0 |
0 |
|
ARDS |
1 |
1.5 |
1 |
10 |
|
Leptospirosis |
2 |
3.1 |
0 |
0 |
|
SBP |
1 |
1.5 |
0 |
0 |
|
Splenic abscess |
1 |
1.5 |
0 |
0 |
|
Pneumonia with UTI |
3 |
4.6 |
1 |
10 |
|
Diarrhea with UTI |
4 |
6.2 |
0 |
0 |
|
Total |
65 |
100 |
10 |
100 |
Table 8 shows the proportion of patients
developing MODS. Out of the 65 patients
with mild sepsis, 26 i.e. 40% developed MODS in contrast to all the patients with severe sepsis,
who developed the same.
Table 8: Multi Organ Dysfunction Syndrome
among sepsis patients
|
MODS |
SOFA |
|||
|
Mild |
Severe |
|||
|
Number |
% |
Number |
% |
|
|
Yes |
26 |
40 |
10 |
100 |
|
No |
39 |
60 |
0 |
0 |
|
Total |
65 |
100 |
10 |
100 |
Table 9 shows the mean values
of serum PCT among the sepsis patients admitted
to ICU. The mean serum PCT levels were found to be significantly higher among patients
with severe sepsis i.e. 46.6±37.6 mg/mL as compared to mild sepsis patients i.e. 17.3±22.7
mg/mL with p- value of 0.001.
Table 9: Serum procalcitonin (PCT) among sepsis patients
|
Variable |
SOFA |
Minimum |
Maximum |
Mean |
SD |
Median |
IQR |
p-value |
|
Ser.PCT |
Mild |
1.3 |
104 |
17.3 |
22.7 |
7.5 |
15.1 |
0.001 |
|
Severe |
5.9 |
132.6 |
46.6 |
37.6 |
36.3 |
41.3 |
Fig. 1 shows
the receiver operator characteristic curve and
area under the curve for serum PCT levels among sepsis patients
admitted to the ICU. AUC for PCT was found to be 0.82, which indicated
it to be a good predictor of sepsis.
After observing various cut-off levels, it was
found that a cut-off of 0.2mg/mL provides the highest negative
predictive value of 97.8%.
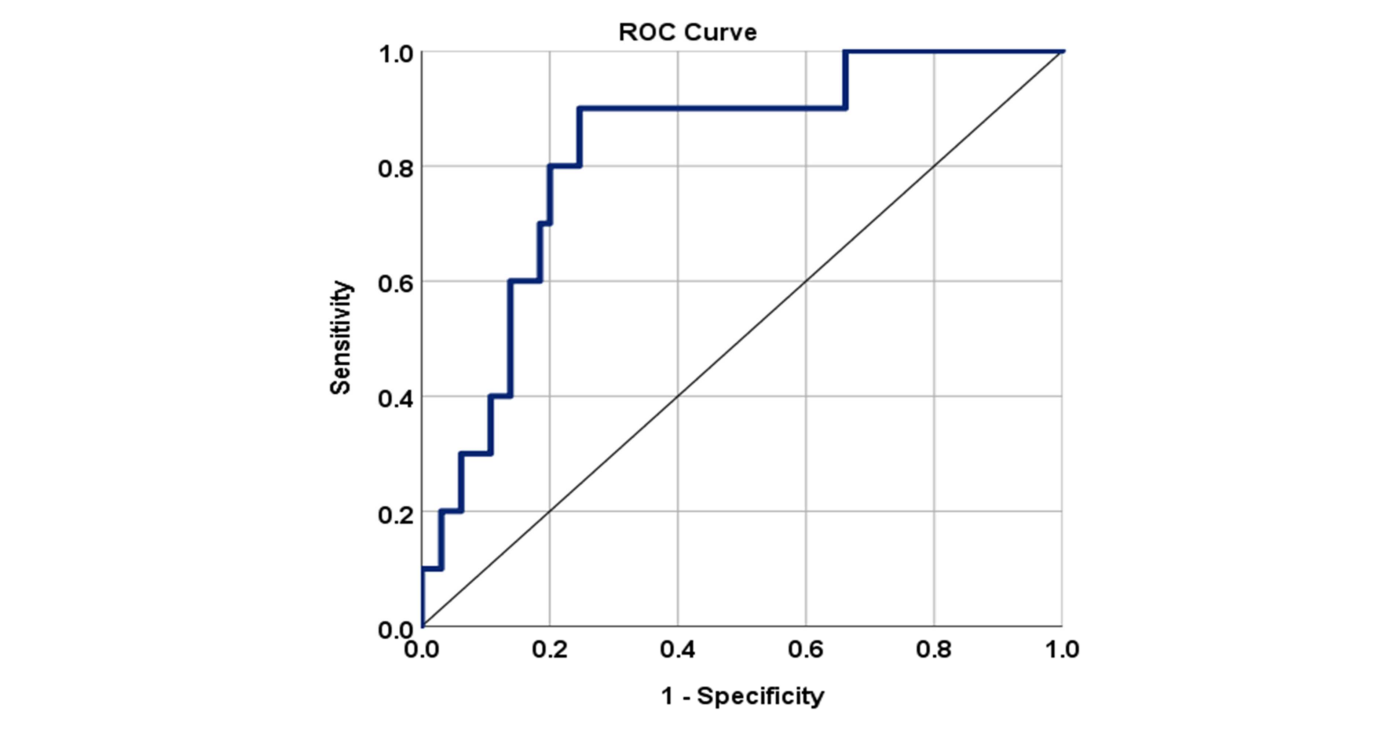
Fig. 1: Receiver operator characteristic curve and area under
the curve for serum PCT levels
Table 10 describes the mean serum CRP values among varying
grades of sepsis patients admitted to the ICU. The
Mean CRP value was found to be lower among patients with severe sepsis i.e. 136.5±63.6 mg/L, as compared to their milder counterparts i.e.
157.8±57.2mg/L. However, this finding was not statistically significant.
Table 10: Serum C-reactive protein
values among sepsis patients
|
Variable |
SOFA |
Minimum |
Maximum |
Mean |
SD |
Median |
IQR |
p-value |
|
Ser. CRP |
Mild |
30 |
342.1 |
157.8 |
57.2 |
144.8 |
82.4 |
0.503 |
|
Severe |
40.9 |
222.9 |
136.5 |
63.6 |
137.7 |
111.9 |
Table 11 shows the outcome of patients according
to the severity of sepsis. More than half of the patients
with severe sepsis i.e., 06 (60%)
succumbed to death whereas only 09 out of 65 patients i.e., 13.8% with mild sepsis faced similar consequence.
This finding was highly significant with p<0.001.
Table 11: Outcome of patients
based on their severity of sepsis
|
Outcome |
SOFA |
|||
|
Mild |
Severe |
|||
|
Count |
% |
Count |
% |
|
|
Death |
9 |
13.8 |
6 |
60 |
|
Survival |
56 |
86.2 |
4 |
40 |
|
Total |
65 |
100 |
10 |
100 |
p<0.001
DISCUSSION- According
to the current study, severe sepsis is more likely to affect older adults. Ageing
is a risk factor for sepsis, according to epidemiological literature [12]. Due to the lack of statistical
significance in age-related differences in Sequential Organ Failure Assessment
(SOFA) scores, greater sample sizes or research population variations are
needed. This
study found no gender difference in sepsis severity, contrary to some previous
studies. Sepsis severity may be affected by gender-specific characteristics for
further study [13]. The mean serum PCT levels were found to be significantly higher among patients
with severe sepsis
i.e., 46.6±37.6 mg/mL, as compared to mild
sepsis patients i.e. 17.3±22.7 mg/mL, with p-value of 0.001. In contrast, the mean CRP value was found to be
non-significantly lower among patients with severe sepsis i.e., 136.5±63.6 mg/mL, as compared
to their milder counterparts i.e. 157.8±57.2mg/mL.
Fever,
chills/rigor, and cough match sepsis symptoms in the literature. The absence of
statistical significance between mild and severe sepsis groups shows that these
symptoms may not accurately predict sepsis severity in this cohort. In many similar studies
conducted by Chirouze et al. [7],
Engel et al. [8], Bossink et al. [9], Hatherhill
et al. [10], the
mean serum PCT levels were significantly higher than CRP and ESR levels, thereby considering PCT to be a
good predictor of bacteraemia among normal,
neutropenia patients as well as pediatric patients with septic shock. However, studies by Tanriverdi et al. [11], and
Meisner et al. [12] argued that there is no difference in predicting
bacteraemia by using CRP and PCT.
As
thrombocytopenia is linked to severe sepsis, severe sepsis patients have a
lower total platelet count than mild sepsis patients [1].
Patients with severe sepsis have lower blood pH, which matches their
physiological decline. In the current study, pneumonia predominated in mild
sepsis cases, and urinary tract infections (UTIs) dominated severe cases.
According to sepsis literature, these characteristics are consistent with
varied infectious causes. The
receiver operator characteristic curve and area under the curve for serum PCT levels among sepsis patients admitted
to the ICU were calculated [5].
AUC for PCT was found to be 0.82,
which indicated it to be a good predictor of sepsis. After observing various cut-off levels, it was
found that a cut-off of 2.2mg/mL provides the
highest negative predictive value of 97.8%. These findings are similar to those
of studies conducted by Sungurtekin et al. [13].
In another similar
study conducted by Chirouze et
al. [7]; it was observed that they have compared the diagnostic value of PCT with other inflammatory parameters like CRP and cytokine levels.
The
high rate of MODS in severe sepsis patients supports the idea that organ
failure is a hallmark. This emphasizes the importance of early detection and
action to prevent MODS [8].
The much higher mean serum PCT levels in severe sepsis patients compared to
mild sepsis patients support numerous studies highlighting PCT's potential as a
biomarker for severity. ROC analysis with a high AUC supports PCT's predictive
capacity. CRP readings are not statistically significant between mild and
severe sepsis, contrary to some literature that suggests CRP is a less specific
but generally available marker of inflammation [10]. Another study by Muller et al. [14]; it
was found that a cut-off value of 1
mg/mL was used and PCT had better
predictive values than both CRP and
IL-6 for the diagnosis of sepsis in patients admitted in ICU. This value is higher than our finding. In another study
by Simon et al. [15]; it was observed that the sensitivity of PCT [(92% [95% CI,
86%–95%] vs. 86% [95% CI, 65%–95%]) for differentiating
bacterial from viral infection was higher than CRP.
The
study's large correlation between sepsis severity and death supports the idea
that severe sepsis is deadly. Therefore, risk classification and sepsis
severity-based therapies are crucial. Hatherhill et al.
[10] found that the area under the ROC curve was 0.96 for PCT
compared with 0.83 for CRP and 0.51 for TLC at 95% CI with p
value<0.001. in contrast to our
findings, studies by Suprin et al. [16] and Ugarte et al.
[17] found that PCT had
poorer sensitivity, specificity and AUC than did CRP as a marker of sepsis.
In another study conducted by Hausfater et al. [18], the optimal
threshold for PCT was confirmed to be 0.2 μg/l and the accuracy of PCT
was found to be 0.50 at 95% CI in
predicting bloodstream infection. The sensitivity and specificity of PCT for detecting bloodstream infections varied from 0.62 to 0.69 and 0.65 to 0.88 in various
other studies conducted
on sepsis patients admitted to
ICU like those by Chan et al. [19]; Fernandez et al. [20];
and Crain et al. [21].
CONCLUSIONS- According
to the results of our investigation, PCT is a more reliable indicator than CRP
for predicting the severity and prognosis of sepsis. The patients with severe
organ dysfunction (SOFA groups 3 and 4) had higher mean serum PCT
concentrations and SOFA scores than patients with mild organ failure.
Sepsis-related deaths among patients were associated with greater mean SOFA
scores and PCT concentrations than survival rates. In individuals with sepsis,
there was no discernible relationship between the mean CRP concentration and
the degree of organ failure or the prognosis. In contrast to CRP, which is
frequently already in the upper concentration range with low SOFA scores, PCT
can be triggered to very high blood concentrations during advanced stages of
MODS. Because the degree of sepsis and its outcome are closely correlated with
PCT levels, PCT has a greater capacity for diagnosis than CRP.
Research
concept- Bideti Sreerekha
Research
design- Sethy Sunita
Supervision- Archana Kumawat
Materials- Santosh Kumar Swain
Data
collection- Suresh Kumar Rout
Data
analysis and Interpretation- Bideti Sreerekha
Literature
search- Sethy Sunita
Writing
article- Archana Kumawat
Critical
review- Santosh Kumar
Swain
Article
editing- Dash Purna
Chandra
Final approval- Rattan Roma
REFERENCES
1.
Angus
DC, Vander Poll T. Severe
sepsis and septic shock.
N Engl J Med., 2013; 36(9): 840-45.
2.
Angus DC, Seymour CW, Coopersmith CM,
et al. A framework for the development and interpretation of different sepsis definitions and clinical criteria.
Crit Care Med., 2016;
44: 113-21.
3.
Vincent J-L, et al. qSOFA does not
replace SIRS in the definition of sepsis. Crit Care, 2016; 20(1): 2-10.
4.
Brabrand M, Havshoj U, Graham CA.
Validation of the qSOFA score for identification of septic patients: a
retrospective study. Eur J Intern Med., 2016; 36: 25-35.
5.
Assicot M, Gendrel D, Carsin H, et al.
High serum procalcitonin concentrations in patients with sepsis and
infection. Lancet., 1993; 341: 515-18.
6.
Meisner M. PCT, procalcitonin - a
new, innovative infection parameter. Berlin: B R A H M S-Diagnostica
GmbH;1996; 12(2): 11-18.
7.
Chirouze C, Schuhmacher H, Rabaud C,
Gil H, Khayat N, et al. Low serum procalcitonin level accurately predicts the
absence of bacteremia in adult patients with acute fever. Clin Infect Dis.,
2002; 35(2): 156-61.
8.
Engel A, Steinbach G, Kern P, et al.
Diagnostic value of procalcitonin serum levels in neutropenic patients with fever:
comparison with in- terleukin-8. Scand J Infect Dis., 1999; 31: 185-89.
9.
Bossink AW, Groeneveld AB TL.
Prediction of microbial infection and mortality in medical patients with fever:
plasma procalcitonin, neutrophilic elastase-a1-antitrypsin, and lactoferrin
compared with clinical variables. Clin Infect Dis., 1999; 29: 398-407.
10. Hatherill
M, Tibby SM, Sykes K, Turner C, Murdoch IA. Diagnostic markers of infection:
Comparison of procalcitonin with C reactive protein and leucocyte count. Arch
Dis Child., 1999; 81(5): 417-21.
11. Tanriverdi
H, Tor MM, Kart L, Altin R, Atalay F, Sumbsümbüloglu V. Prognostic value of
serum procalcitonin and C-reactive protein levels in critically ill patients
who developed ventilator-associated pneumonia. Ann Thorac Med., 2015; 10(2):
137-42.
12. Meisner
M, Tschaikowsky K, Palmaers T, Schmidt J. Comparison of procalcitonin (PCT) and
C-reactive protein (CRP) plasma concentrations at. Crit Care, 1999; 3: 45-50.
13. Sungurtekin
H, Bacli C, Gürses E, Sungurtekin
U, Kaptanoǧlu B. Usefulness of procalcitonin for diagnosis of sepsis in the
intensive care unit. Crit Care, 2003; 7(1): 85-90.
14. Muller
B, Schuetz P,
Christ-Crain M, Huber AR. Long-term stability of procalcitonin in frozen samples and
comparison of Kryptor and VIDAS automated immunoassays: Clin Biochem., 2010;
43: 341-44.
15. Simon
L, Gauvin F, Amre DK et al. Serum procalcitonin and C-reactive protein levels
as markers of bacterial infection: a systematic review and meta-analysis. Clin
Infect Dis., 2004; 39: 206-17.
16. Suprin
E, Camus C, Gacouin A, Le Tulzo Y, Lavoue S, et al. Procalcitonin: A valuable
indicator of infection in a medical ICU? Intensive Care Med., 2000; 26(9): 1232-38.
17. Ugarte
H, Silva E, Mercan D, De Mendo A, Vincent JL. Procalcitonin used as a marker of
infection in the intensive care unit. Crit Care Med., 1999; 27(3): 498-504.
18. Hausfater
P, Juillien G, Madonna PB, Haroche J, et al. Serum procalcitonin measurement as
diagnostic and prognostic marker in febrile adult patients presenting to the
emergency department. Crit Care, 2007; 11(3): 1-9.
19. Chan
YL, Tseng CP, Tsay PK, Chang SS, et al. Pro- calcitonin as a marker of
bacterial infection in the emergency department: an observational study. Crit
Care., 2004; 8: 12-20.
20. Fernandez
Lopez A, Luaces Cubells C, et al. Spanish Society of Pediatric Emergencies: Procalcitonin
in pediatric emergency departments for the early diagnosis of invasive
bacterial infections in febrile infants: results of a multicenter study and
utility of a rapid qualitative test for this marker. Pediatr Infect Dis J.,
2003; 22: 895-903.
21.
Crain CM, Jaccard-Stolz D, Bingisser
R, Gencay MM, et al. Effect of procalcitonin-guided treatment on antibiotic use
and outcome in lower respiratory tract infections: cluster-randomised,
single-blinded intervention trial. Lancet, 2004; 363(9409):
600-07. doi: 10.1016/S0140-6736(04)15591-8.