Key-Words- East Kolkata Wetlands (EKW), Phytoplankton, Chlorophyll a, Nutrients, ANOVA
INTRODUCTION- Wetlands are one of the most productive ecosystems of the planet Earth [1-3]. East Kolkata Wetlands (EKW) present in the maritime state of West Bengal (India) has been designated as Ramsar Site and is noted for its high nutrient level and considerable fish production [4-6].
Many reports of EKW include management programmes to conserve this well known wetland which spans over the entire eastern outskirts of the metropolitan city of Kolkata [6-9]. However, very few works documented the inter-relationship between relevant hydrological parameters and phytopigment (chlorophyll a) which may serve as proxy to primary productivity of the aquatic system.
The present paper analysis the dependency of chlorophyll a on the nutrient levels in the aquatic phase of EKW. For this, a data bank of three decades (1984–2015) has been relied upon to interpret the result. This data bank is the average of three seasons in the three sampling bheries selected in EKW and is retrieved from the archives of Department of Marine Science, University of Calcutta.
MATERIALS AND METHODS
Study Site- EKW is situated at the eastern outskirts of the mega city of Kolkata, India (22o25' to 22o40' N and 88o20' to 88o35' E). The fish ponds of the area offers important ecosystem services like flood control, recycling of municipal wastes and effluents (generated from urban and semi urban areas), aesthetic beauty, fish production, livelihood, etc. EKW is extremely dynamic from the point of view of primary production and is a unique reservoir of a galaxy of phytoplankton, which serve as the foundation stone of food chain ex-isting in the system. The present sampling bheries were selected at Captain Bheri (22o33’06.7” N to 88o24’38.5” E), Munshir Bheri (22o34’18.3” N to 88o26’22.9” E) and Natur Bheri (22o32’49.9” N to 88o25’30.1” E) with the aim to analyze the chlorophyll a and few relevant physio-chemical variables (like surface water temperature, pH, dissolved oxygen, nitrate, phosphate and silicate).
Analysis of Hydrological Parameters- Surface water temperature was recorded by using a 0o–100oC mercury thermometer and pH of the surface water was measured by using a portable pH meter (sensitivity = ±0.01). The dissolved oxygen was measured by a DO meter in the field and subsequently cross-checked in the laboratory by Winkler’s method.
Surface waters for nutrient analyses were collected in clean TARSON bottles and were transported to the laboratory in ice-freeze condition. Triplicate samples were collected from the same collection site to maintain the quality of the data. The standard spectrophotometric method [10] was adopted to determine the nutrient concentration in surface water. Nitrate was analysed by reducing it to nitrite by means of passing the sample with ammonium chloride buffer through a glass column packed with amalgamated cadmium filings and was finally treated with sulphanilamide solution. The resultant diazonium ion was coupled with N - (1-napthyl)- ethylene diamine to give an intensely pink azo dye. Determination of the phosphate was carried out by treatment of an aliquot of the sample with an acidic molybdate reagent containing ascorbic acid and a small proportion of potassium antimony tartarate. Dissolved silicate was determined by treating the sample with acidic mo-lybdate reagent.
Pigment Analysis- For pigment analysis, 1 litre of surface water was col-lected from each of the sampling sites and filtered through a 0.45 µm Millipore membrane fitted with a vacuum pump. The residue along with the filter paper was dissolved in 90% acetone and was kept in a refrigerator for about 24 hours in order to facilitate the complete extraction of the pigment. The solution was then centrifuged for about 20 minutes at 5000 rpm and the supernatant solution was considered for the determination of the chlorophyll pigment by recording the optical density at 750, 664, 647 and 630 nm with the help of Systronics UV-visible spectrophotometer model No-117 (micro controller based). All the extinction values were corrected for a small turbidity blank by subtracting the 750 nm signal from all the optical densities, and finally the phytoplankton pigment was estimated as per the following expression of Jeffrey and Humphrey (1975) [11].
All the extinction values were corrected for a small turbidity blank by subtracting the 750 nm signal from all the absorbance values. The values obtained from the equations were multiplied by the volume of the extract (in ml) and divided by the volume of the water (in litre) filtered to express the chlorophyll a content in mg.m-3. All the analyses were done in triplicate (on the basis of collection of three samples from the same site) in order to ensure the quality of the data.
STATISTICAL ANALYSIS- It is the final phase in which statistical tools were applied to understand the spatio-temporal variation in the study site. For this, ANOVA was performed to evaluate statistically significant differences between years and selected bheries.
RESULTS AND DISCUSSION- Surface water temperature, pH, dissolved oxygen, nutri-ents level and chlorophyll a concentration recorded in the three sampling sites are shown in Figures 1-7.
All these hydrological parameters were subjected to ANOVA and significant variations (p < 0.01) were observed between years and bheries (Tables 1-7). This may be due to different standing stock of phytoplankton present in the selected bheries (Annexure 1). The profiles of the selected hydrological parameters are discussed separately.
Temperature- Surface water temperature ranged from 29.2oC (in Natur Bheri during 1984) to 32oC (in Munshir Bheri during 2015) (Figure 1). There exist pronounced variations in surface water temperature between years and bheries (p < 0.01) as depicted in Table 1. The variation between the three selected bheries may be attributed to different degrees of exposure to solar radiations although they are located in the same geographical locale of EKW. The shades provided by the vegetations around the selected bheries may be related to such local level variations.
The yearly variation pointed out towards the gradual warming of the atmosphere due to climate change in-duced warming in this tropical belt as pointed out by earlier researchers [2-3, 12-13].
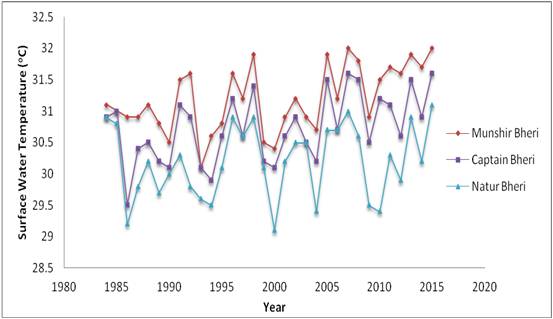
Figure 1: Decadal variations of surface water temperature
| Source of Variation for Surface water temperature | SS | df | MS | F | P-value | F crit |
|---|---|---|---|---|---|---|
| Between Years | 29.37 | 31 | 0.95 | 23.70 | 3.97 × 10⁻²⁴ | 1.64 |
| Between Bheries | 2.34 | 2 | 1.17 | 29.30 | 1.1 × 10-09 | 3.15 |
| Error | 2.48 | 62 | 0.04 | |||
| Total | 34.19 | 95 |
pH- The pH of the waters in the study sites ranged from 6.7 (in Captain Bheri during 1990) to 8.2 (in Captain Bheri during 2015) (Figure 2). It is interesting to note that unlike other parameters, the pH of the aquatic phase in the selected bheries of the bheries of EKW did not exhibit any pronounced variation (Table 2). This is due to the fact that all these bheries are managed by the local people who use lime on regular basis to maintain the acid-base balance of the water bodies.
Table 2: ANOVA result for pH
| Source of Variation for pH | SS | df | MS | F | P-value | F crit |
|---|---|---|---|---|---|---|
| Between Years | 2.52 | 31 | 0.08 | 1.31 | 0.18 | 1.64 |
| Between Bheries | 0.09 | 2 | 0.04 | 0.70 | 0.50 | 3.15 |
| Error | 3.86 | 62 | 0.06 | |||
| Total | 6.48 | 95 |
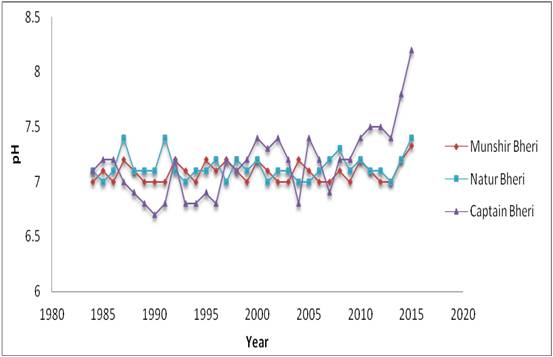
Figure 2: Decadal variations of pH
Table 3: ANOVA result for Dissolved Oxygen
| Source of Variation for Dissolved Oxygen | SS | df | MS | F | P-value | F crit |
|---|---|---|---|---|---|---|
| Between Years | 10.12 | 31 | 0.33 | 4.44 | 2.99 × 10-07 | 1.64 |
| Between Bheries | 6.51 | 2 | 3.26 | 44.28 | 1.14 × 10⁻¹² | 3.15 |
| Error | 4.56 | 62 | 0.07 | |||
| Total | 21.19 | 95 |
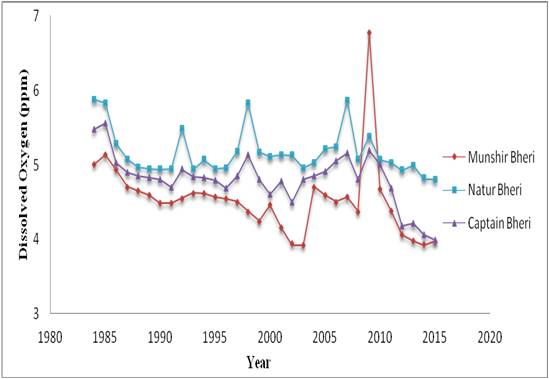
Figure 3: Decadal variations of Dissolved Oxygen
Table 4: ANOVA result for Nitrate
| Source of Variation for Nitrate | SS | df | MS | F | P-value | F crit |
|---|---|---|---|---|---|---|
| Between Years | 3933.01 | 31 | 126.87 | 59.39 | 1.47 × 10⁻³⁵ | 1.64 |
| Between Bheries | 131.92 | 2 | 65.96 | 30.88 | 4.96 × 10⁻¹⁰ | 3.15 |
| Error | 132.46 | 62 | 2.14 | |||
| Total | 4197.39 | 95 |
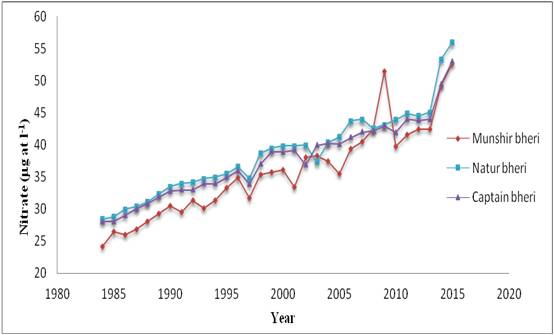
Figure 4: Decadal variations of Nitrate
| Source of Variation for phosphate | SS | df | MS | F | P-value | F crit |
|---|---|---|---|---|---|---|
| Between Years | 39.62 | 31 | 1.28 | 6.21 | 5.8 × 10⁻¹⁰ | 1.64 |
| Between Bheries | 21.83 | 2 | 10.91 | 53.04 | 3.74 × 10⁻¹⁴ | 3.15 |
| Error | 12.76 | 62 | 0.21 | |||
| Total | 74.20 | 95 |
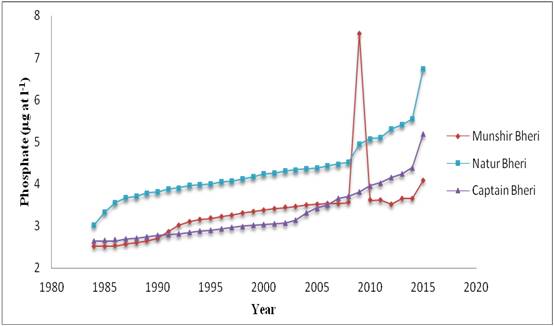
Figure 5: Decadal variations of Phosphate
| Source of Variation for Silicate | SS | df | MS | F | P-value | F crit |
|---|---|---|---|---|---|---|
| Between Years | 5566.70 | 31 | 179.57 | 7.411 | 1.47 × 10⁻¹¹-11 | 1.64 |
| Between Bheries | 2245.80 | 2 | 1122.90 | 46.34267 | 4.91 × 10⁻¹³-13 | 3.15 |
| Error | 1502.28 | 62 | 24.23 | |||
| Total | 9314.77 | 95 |
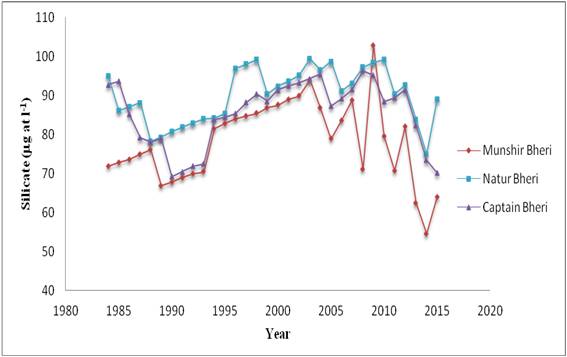
Figure 6: Decadal variations of Silicate
Chlorophyll a, the primary constituent of phytoplankton needs special importance with respect to maintenance of ecological stability, primary production and energy flow through the food chains spun in the water bodies of EKW through long evolutionary period of time. The decreasing trend of chlorophyll a is a warning signal in context to primary production of the system as the dynamics of energy flow in any aquatic system is regulated by phytoplankton standing stock with chlorophyll a, as its major constituents. Hence regular monitoring and conservation of these free floating tiny producer community is extremely important to upgrade the ecological health of the system. The dependency of phytoplankton on nutrient levels demands the regulation of waste discharge in the EKW so as to optimize the growth of phytoplankton. The local economy and livelihood of EKW is primarily pisci-centric and therefore the primary producer community needs to be conserved in order to generate a sustainable secondary production.
Table 7 ANOVA result for Chlorophyll a
| Source of Variation for Chlorophyll a | SS | df | MS | F | P-value | F crit |
|---|---|---|---|---|---|---|
| Between Years | 104.29 | 31 | 3.36 | 26.52 | 1.76 × 10⁻²⁵ | 1.64 |
| Between Bheries | 253.92 | 2 | 126.96 | 1000.96 | 6.44 × 10-48-48 | 3.15 |
| Error | 7.86 | 62 | 0.13 | |||
| Total | 366.07 | 95 |
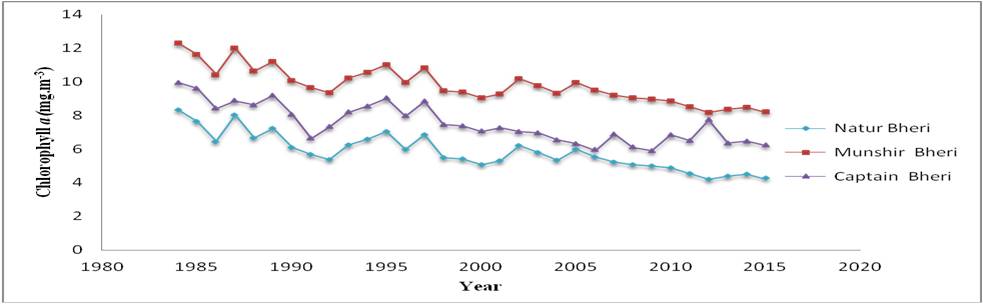
Figure 7: Decadal variations of Chlorophyll a
Significant variations of hydrological parameters exist between the selected bheries (except aquatic pH), which might be due to different nutrient supply (preferably through sewage) to the bheries.
The uniformity of aquatic pH may be attributed to application of lime on regular basis, which is a common prac-tice of the beneficiaries of the bheries of EKW.
Chlorophyll a, which is proxy to the productivity of the bheries oscillates as a function of nutrient load of the aquatic phase. Hence, regulation of nutrients is of utmost importance to maintain the productivity of the bheries located in the EKW.
Annexure 1: Standing stock of phytoplankton species in the selected sites of East Kolkata Wetlands
| S. No. | Phytoplankton Species | Standing Stock (No./L) | ||
|---|---|---|---|---|
| Captain Bheri | Munshir Bheri | Natur Bheri | ||
| 1 | Merismopedia trolleri | 10132.49 | 8952.38 | 12632.06 |
| 2 | Merismopedia glauca | 9133.41 | 8797.29 | 10700.41 |
| 3 | Merismopedia minima | 2384.49 | 2250.07 | 2762.49 |
| 4 | Merismopedia punctata | 33519.31 | 31950.14 | 35252.09 |
| 5 | Synechococcus elongatus | 4316.18 | 4158.55 | 4699.3 |
| 6 | Synechocystis aquatilis | 3522.94 | 3404.25 | 4046.49 |
| 7 | Coelosphaerium pallidum | 225131.2 | 218202.63 | 227153.21 |
| 8 | Rhabdogloea rhaphidioides | 23381.79 | 21894.74 | 24735.6 |
| 9 | Rhabdoderma irregular | 867.82 | 651.18 | 1209.82 |
| 10 | Rhabdoderma lineare | 413.65 | 324.78 | 533.65 |
| 11 | Rhabdogloea fascicularis | 1420.8 | 1255.07 | 1555.88 |
| 12 | Rhabdogloea smithii | 20300.37 | 19240.8 | 20768.98 |
| 13 | Microcystis aeruginosa | 3603.63 | 3757.13 | 4301.63 |
| 14 | Chroococcus disperses | 4724.94 | 4171.14 | 5334.15 |
| 15 | Chroococcus dispersus var. minor | 4152.08 | 3764.9 | 4590.08 |
| 16 | Chroococcus limneticus | 1185.05 | 1005.77 | 1474.05 |
| 17 | Chroococcus turgidus | 1170.16 | 1009.27 | 1284.2 |
| 18 | Gomphosphaeria aponina | 37792.22 | 36521.99 | 39088.83 |
| 19 | Spirulina subsalsa | 40750.11 | 37024.92 | 42018.74 |
| 20 | Spirulina nordstedtii | 38358.4 | 35577.78 | 39671.08 |
| 21 | Spirulina subtilissima | 2259.56 | 2241.1 | 3861.23 |
| 22 | Spirulina laxissima | 1832.76 | 1901.92 | 2565.09 |
| 23 | Pseudanabaena catenata | 1634.5 | 1649 | 2467.42 |
| 24 | Planktolyngbya contorta | 1838.47 | 1644.05 | 2018.14 |
| 25 | Pseudanabaena galeata | 2338.18 | 2151.66 | 2704.98 |
| 26 | Oscillatoria subbrevis | 3478.13 | 3188.87 | 3821.97 |
| 27 | Oscillatoria limnetica | 16495.92 | 15691.4 | 17228.5 |
| 28 | Oscillatoria rubescens | 28315.68 | 26456.24 | 29066.02 |
| 29 | Oscillatoria acutissima | 108.37 | 85.8 | 242.27 |
| 30 | Cyanarcus hamiformis | 8852.51 | 8316.51 | 9318.79 |
| 31 | Anabaenopsis raciborskii | 35155.48 | 33211.39 | 36309.34 |
| 32 | Anabaenopsis arnoldii | 3290.73 | 3213.38 | 3901 |
| 33 | Anabaenopsis circularis | 283.3 | 212.06 | 404.23 |
| 34 | Anabaenopsis Tanganyika | 2152.19 | 1981.33 | 2507.89 |
| 35 | Navicula cryptocephala | 299.45 | 240.1 | 409.46 |
| 36 | Navicula peregrine | 127.6 | 85.39 | 197.536 |
| 37 | Navicula tripunctata | 185.46 | 154.16 | 266.12 |
| 38 | Navicula phyllepta | 2654.14 | 2548.63 | 2969.27 |
| 39 | Craticula halophila | 1327.03 | 1216.92 | 1558.98 |
| 40 | Craticula cuspidate | 45702.66 | 41648.81 | 48377.66 |
| 41 | Cymbella lanceolata | 2480.27 | 2228.71 | 2731.72 |
| 42 | Pleurosigma angulatum | 492.5 | 386.43 | 613.5 |
| 43 | Amphora coffeaeformis | 449.5 | 318.33 | 629.39 |
| 44 | Nitzschia acicularis | 587.8 | 439.2 | 732.92 |
| 45 | Nitzschia frustulum | 613.2 | 475.34 | 745.29 |
| 46 | Nitzschia palea | 4868.8 | 4479.54 | 5170.93 |
| 47 | Nitzschia fruticosa | 661.5 | 585.46 | 758.9 |
REFERENCES
- Ghermandi, A., Van den Bergh, J.C.J.M., Brander & L.M., Nunes, P.A.L.D. The economic value of wetland conservation and creation: a meta-analysis. [Working Paper 79]. Fondazione Eni Enrico Mattei, Milan, Italy, 2008.
- Mitra A. In: Sensitivity of Mangrove ecosystem to changing Climate. Springer; 2013: pp. 323.
- Mitra, A. & Zaman, S. Basics of Marine and Estuarine Ecology, Springer India, 2016.
- Roy, A., Banerjee, A., Roy, R., Biswas, S., Roy, M. & Mitra, A. Decadal variation of major nutrients in the aquatic phase of East Kolkata Wetlands. International Journal of Innovative Research in Science, Engineering and Technology, 2016, 5(3), pp. 2950-2957.
- Tyrrel, S.F., “The Microbiological Quality of Water Used for Irrigation.”, Irrigation News, 1999, 27, pp. 39-42.
- Kundu. N., Pal, M. & Saha S. East Kolkata Wetlands: A resource recovery system through productive activities. Proceedings of Taal 2007: The 12th World Lake Conference, 2008, pp. 868-881.
- Pradhan, A., Bhaumik, P., Das, S., Mishra, M., Khanam, S., Hoque, B.A., Mukherjee, I., Thakur, A.R. & Ray Chaudhuri, S. Phytoplankton diversity as indicator of water quality for fish cultivation. American Journal of Environmental Science, 2008, 4, 406-411.
- Raychaudhuri, S., Salodkar, S., Sudarshan, M. & Thakur, A. Integrated Resource Recovery at East Calcutta Wetland: How Safe is these?. American Journal of Agricultural and Biological Science, 2007, 2(2), pp. 75-80.
- Ray Chaudhuri, S., Mishra, M., Nandy, P. & Thakur, A.R. Waste management: A case study of ongoing traditional practices at east Calcutta wetland. American Journal of Agricultiural and Biological Sciences, 2008, 3, pp. 315-320.
- Strickland, J.D.H. & Parsons, T.R. A practical handbook of seawater analysis. Fisheries Research Board of Canada, Ot-tawa, 1972, 310.
- Jeffrey, S.W. & Humphrey, G.R. New spectrophotometric equations for determining chlorophylls a, b. c, and c2 in higher plants, algae and natural phytoplankton. Biochem. Physiol. Pflanz., 1975, 167, pp. 191-194.
- Mitra, A., Banerjee, K., Sengupta, K. & Gangopadhyay. A. Pulse of climate change in Indian Sundarbans: A myth or re-ality?. National Academy of Science Letter, 2009, 32 (1 & 2), pp. 19-25.
- Mitra, A. & Zaman, S. Carbon Sequestration by Coastal Floral Community. The Energy and Resources Institute (TERI), TERI Press, India, 2014.
- Roy, A., Amin, G., Agarwal, S. K., Pramanick, P., Banerjee, A., Roy, M. & Mitra, A. Water Quality Index (WQI) of East Kolkata Wetland using Dissolved Oxygen as Proxy. International Advanced Research Journal in Science, Engineering and Technology, 2016, 3(2), pp. 22-24.
- Luger, M. & Brown, C. The impact of treated sewage effluent on urban rivers. an ecological, social and economic Perspective, 1999.
- Conley, D.J. Terrestrial ecosystems and the global biogeochemical silica cycle. Global Biogeochemical Cycles, 2002, 16, pp. 1121–1129.
- Greenwood, J.E., Truesdale, V.W. & Rendell, A.R. Biogenic silica dissolution in seawater-in vitro chemical kinetics. Proggress in Oceanography, 2001, 48, pp. 1–23.
- Riley & Chester. Introduction to Marine Chemistry. Academic Press. INC., 1971.
- Mitra, A., Banerjee, K. & Bhattacharyya, D.P. A study on phytopigment spectrum in relation to anthropogenic pressure around the Indian Mangrove Ecosystem. Indian Science Cruiser, 2003, 17(3), pp. 29-36.
- Mitra, A., Banerjee, K., Choudhury, A. & Bhattacharyya, D.P. Taxonomy of coastal phytoplankton inhabiting polluted waters. Ecology of Polluted Waters (Editor Arvind Kumar, IJEE), 2002, chapter-78.
- Banerjee, K., Mitra, A., Bhattacharyya, D.P. & Choudhury, A. Role of nutrients on phytoplankton diversity in the north–east coast of the Bay of Bengal. Ecology and Ethology of Aquatic Biota (Editor Arvind Kumar, IJEE), 2002, chapter-6, pp. 102-109.
- Banerjee, K., Mitra, A., Bhattacharyya, D.P. & Choudhury, A. A preliminary study of phytoplankton diversity and water quality around Haldia port-cum-industrial complex. Proceedings of the National Seminar on Protection of the Environment - An urgent need IPHE, Kolkata. 2000.
- Lilli, C.M. & Parsons, T.R. Biological Oceanography – An Introduction, 2nd Edition, The Open University Set Book. 1997.
| Source of Financial Support: Nil Conflict of interest: Nil |
| International Journal of Life-Sciences Scientific Research (IJLSSR) Open Access Policy Authors/Contributors are responsible for originality, contents, correct references, and ethical issues. IJLSSR publishes all articles under Creative Commons Attribution- Non-Commercial 4.0 International License (CC BY-NC). https://creativecommons.org/licenses/by-nc/4.0/ |