Key-Words- Bread wheat, stress tolerance indices
INTRODUCTION- Almost 32 percent of the wheat (Triticum aestivum L.) in developing countries, a variety of water stress during the growing season experience [1]. High levels of evaporation and transpiration, soil physicochemical properties, characteristics of poor agricultural crops and inappropriate management of water makes with limitations, especially in rain-fed wheat yield at a low level [2]. In areas such as Iran that the low rainfall and its distribution from year to year are variable, it is difficult to predict the amount and distribution of rainfall. Under such conditions the yield in consecutive years shows great variations. Because of the increase in wheat yield in these areas through breeding and production of compatible cultivars resistant not been very successful because of plant traits and many factors are involved in the expression of the phenomenon of drought resistance and yields and the attributes of together inte-ract so the need for more comprehensive studies to be felt. The studies done in shallow water environments and with enough water to show that the susceptibility of plants to drought stress is different, and this depends on the severity of the drought sensitivity setting [3].
MATERIALS AND METHODS To evaluate indicators of stress and stress-tolerant genotypes 40 wheat genotypes were used. Genotypes used as commercial varieties and promising lines of temperate zone countries were selected for this study. Tested in a randomized complete block design with three replications under normal and drought (50% flowering) was conducted in Agriculture Natural Resource Education Research Center of Tehran province (varamin) in 2012. In order to provide the necessary conditions for stress after 50% flowering stage, but there was no other water in the irrigation normal testing continued until physiological maturity. Winter Sowing seeds using Planter Germany. Each unit consisted of two stacks over 6 meters and a width of 1.2 cm and seed rate was calculated based on the weight of the grain Seeds before planting carboxyinthiram. At a rate of two per thousand were disinfected. According to the results of soil tests, urea and phosphate fertilizers were used. Since MSTATC software for analysis of variance and mean comparison (Duncan's multiple range tests at 1% and 5%, and principal component analysis and biplot from SPSS software was used. MSTATC software for analysis of variance and mean comparison (Duncan's multiple range test at 1% and 5%, and Assay component analysis and biplot from SPSS software was used. To study the relationship between indicators traced graphics were used biplot. Biplot useful tool for analysis and evaluation of information is two-way matrix structure [4]. Using grain yield in stress conditions (ys) and normal (YP) were calculated, based on quantitative indicators tolerance. To estimate the performance indicators of drought tolerance and susceptibility genotypes in each of stress (ys) individually with the performance of genotypes under drought stress (YP) were used [5]. The genotypes of the tolerant and sensitive to conditions different environment were assessed. Fisher and Maurer (1978) suggested that the stress susceptibility index is calculated as follows.
The numerical value of stress susceptibility index, is less sensitive to stress less tolerance to stress is relative and there was a positive correlation between SSI and YP and ys average yield in drought stress conditions are normal [6].
Tolerance Index (TOL)- Mean productivity (MP) stress tolerance index (TOL) as the difference between the yield stress (ys) and stress (YP) and average productivity (MP) as the average of the two Without stress environment defined stress that its calculation method is as follows. High levels of tolerance index indicate greater sensitivity of genotypes to drought stress. So for favorable genotypes, low tolerance index, a benchmark is appropriate.
MP = YP+ ys/2
Selection is based on the index due to low yield geno-types under optimum conditions and high performance under stress conditions will be. Selection based on the average productivity (MP) in non-stress and stress is associated with a higher numerical value of the index tend to genotypes with yield potential is lower than higher tolerance to stress.
Stress Tolerance Index (STI)- Fernandez [5], another indicator of stress (STI) to identify genotypes that presented a high yield stress in normal conditions is calculated as follows:
Harmonic Mean (HARM)- As well as Fernandez [5], another index called the harmonic mean that would be used to select genotypes in the stress condition,
Geometric Mean Productivity (GMP)- Fernandez [5], also known as geometric mean productivity index (G AM) to identify drought resistant genotypes using Correlation between GMP and STI expression that is equal to one.
High levels of these two indicators showed more tolerant genotypes to stress index is less sensitive to the difference between yp and ys, while MP index is based on the arithmetic mean of the relative differences between yp and ys up with errors up to be so the index better than the indices MP group A from the rest of the group and the formula determines YSI = YS / YP is yield stability index In this regard, YP YS, YP»YS» yield under normal conditions, performance under drought, the average yield of genotypes in normal conditions and average yield of genotypes in drought stress conditions.
RESULTS AND DISCUSSION- Analysis of variance for grain yield Table 1 shows significant differences in the level of 5% between genotypes were studied in normal and drought conditions. So call genotypes in both environments reflect the diversity of the population was assessed. The Table [2] Maximum yield stress of genotypes 6,37,38 and 39, respectively, with values No. 478.66, 488.16, 501.31 and 501.43 grams per square meter and on the comparison of the class a and b, respectively. Genotype 2 with a yield of 417 grams per square meter and the lowest yield was in class d. Under normal conditions the highest yield of 19.11 genotypes, 39 and 38, respectively, with values of 576, 574.62, 563.66 and 586.33 grams per square meter, compared with the average in the class a and b and the lowest yield of 40 to 492 grams per square meter genotype was in the class e. According to Table 2 index (TOL) minimum number of genotypes 8, 37, 39 and 38, which represents the genotype is drought tolerant and genotypes with high performance 37.39 and 38 both situations, the lines can be considered drought tolerant lines Used and the SSI index of 37.39 and 38 genotypes, have the lowest value and are seen as resistant genotype and genotype No. 6 and 11 despite average performance in both these indices as a drought tolerant genotypes were introduced. So TOL and SSI indicators drought tolerant genotypes or less sensitive to the show and the two indices have the same recognition and better than the indexes used in the removal of sensitive data. The index is less sensitive to drought tolerance is lower and more desirable [7]. Based on stress tolerance indicators, mean productivity, geometric mean productivity 21, 11, 6, 37, 38 genotypes 39 and based on the harmonic mean and 39 the highest value to your 21, 11, 6, 37, and 38 re-spectively. Genotypes 6, 37, 38 and 39 with a relatively high yield in both normal and drought conditions as drought tolerant genotypes were introduced. According to the methodology used in the study of stress tolerance when phenotypic index, mean productivity, geometric mean harmonic mean more productivity and less stress tolerance and susceptibility values than the other genotypes have better tolerance to stress conditions. According to Table 2, it was found that genotypes 21, 11, 6, 37, 38 number 39 in terms of stress tolerance indicators, mean productivity, geometric mean productivity and harmonic mean and maximum values allocated to the index components are tolerant genotypes. As shown in Table 3 shown tolerance indicators, mean productivity, geometric mean productivity and a significant positive correlation between mean harmonic grain yield under normal and drought conditions were, therefore indicators to identify the best indicators These results are superior genotype [1,8] is consistent. Performance indicators and significant positive correlation with grain yield in stress conditions. And genotypes based solely on grain yield genotypes with high performance ratings, and could recognize both. Yield stability index has a significant positive correlation with yield under stress and signif-icant negative correlation with the yield under normal conditions. Thus genotypes with high yield stress and a poor performance in normal conditions chooses these findings [9-10] correspond. The correlation between sensitivity to stress and stress tolerance and grain yield was negative. Since the genotypes with smaller amounts of sensitive indicators and tolerance to stress, known as tolerant genotypes selection based on these indices genotypes that high performance stress, but their performance in environment low normal [9]. Principal component analysis PCA using data from 40 indicators of drought tolerant genotypes and share components and cumulative share were calculated. These results showed that at 50% flowering 99.9 all data changes by the first two principal components (PCA1, PCA2), so biplot was based on two main components Fig 1. In this study, the main component of the first and second principal component 65.5and 34.4% of the total variation explained. Since the first component covers the changes that are not explained by the second component and vice-versa. For this reason, the two components can be displayed in two perpendicular axes and based on the two genotypes in the biplot indicated. In Biplot drawn on the basis of the first and second principal component [1] genotypes within the groups that are associated with yield and stress tolerance it. Biplot Fig 1 shows that genotypes No. 37, 38, 39 and 27 in the vicinity of vectors quit drought tolerance index (STI), the average geometric the average productivity and efficiency) were evaluated. The genotype of 29, 35.28 and 20 also were in the vicinity of indicators sensitivity and tolerance. Therefore, these genotypes are susceptible to drought and adaptation to the environment is normal. Acute angle between stress tolerance indicators, the average productivity, geometric average productivity and harmonic mean signify the high correlation between these indicators. Indicators average productivity, geometric mean productivity and stress tolerance has a positive correlation with performance in both environments. The amount of these indicators are favorable, so the high level of the first main component, selected varieties that have high performance and high levels of average productivity indicators average, geometric mean productivity and stress tolerance are. The main components of the first component naming the potential and yield stability drought tolerance. There is a high correlation between tolerance and sensitivity to tension with each other, and the negative correlation of these indicators with performance under stress, and high positive correlation with yield under normal conditions were observed in the biplot. The second main component can be awarded as a component named stress susceptibility component can detect genotypes with low yield stress. Using principal component analysis and biplot for durum wheat genotypes incurred [11-12] have been approved. Summary results of the survey show the results of the correlation of grain yield in normal conditions and drought tolerance indices, principal component analysis and biplot, the best indicator for screening wheat genotypes are. Resistance in terms of the index of average productivity, geometric mean productivity, stress tolerance and harmonic represents a resistance; higher yield potential is more genotype. Resistance in terms of the index of average productivity, geometric mean productivity, stress tolerance and harmonic represents a resistance; higher yield potential is more genotypes. Therefore, these indicators enable the separation of group A from B & C. According to Table 2 genotypes 37, 38, 39 and 27 for each indicator, the highest value and represents an acceptable performance and high resistance to drought stress is normal and drought tolerant genotypes to be introduced.
Table 1. Analysis of variance for grain yield under normal and drought conditions on the genotypes studied
| MS | SOV | df | Yield in normal | Yield in stress |
|---|---|---|---|
| Repeat | 2 | 1.73 | 8.58 |
| Genotypes | 39 | 5.2* | 4.25* |
| Error | 78 | 1.8 | 1.56 |
| CV | - | 15.8 | 17.6 |
Table 2. Calculate the amount resistance genotypes drought resistance indices in both desirable environment and stress
| NO | Ys g/m-2 | Yp g/m-2 | TOL | SSI | STI | MP | GMP | HAM /m-2 |
|---|---|---|---|---|---|---|---|---|
| 5 | 424hi | 499hi | 120 | 1.96 | 1787.91 | 461.5 | 459.91 | 45.458 |
| 40 | 433efg | 493i | 110 | 1.83 | 1803.58 | 463 | 462.01 | 461.05 |
| 30 | 434.66efg | 494hi | 5933 | 1.00 | 1812.08 | 464.33 | 463.20 | 462.43 |
| 35 | 432fgh | 499hi | 67 | 1.12 | 1819.59 | 465.5 | 464.17 | 466.59 |
| 3 | 426.34hi | 510.33ghi | 84 | 1.37 | 1837.07 | 468.33 | 466.32 | 464.59 |
| 24 | 437.32ef | 500ghi | 62.67 | 1.05 | 1849.87 | 468.66 | 467.56 | 466.56 |
| 8 | 449.33cd | 491.33i | 42 | 0.72 | 1864.59 | 47.033 | 469.74 | 445.7 |
| 26 | 431.56ghi | 514.33ghi | 82.66 | 1.30 | 1872.66 | 473 | 470.68 | 464.95 |
| 22 | 432.35fgh | 516.66ghi | 84.33 | 1.35 | 1882.35 | 474 | 472.20 | 470.75 |
| 20 | 420.36i | 531efg | 100.66 | 1.74 | 1882.94 | 475.66 | 471.22 | 469.59 |
| 7 | 449.66cd | 510.66ghi | 61 | 1.002 | 1942.02 | 480.16 | 479.15 | 478.22 |
| 34 | 437.6ef | 525.66fghi | 88 | 1.37 | 1939.51 | 481.66 | 479.14 | 477.60 |
| 2 | 417i | 547def | 130 | 1.96 | 1924.08 | 482 | 477.98 | 473.23 |
| 23 | 431.55ghi | 533.65efg | 102.33 | 1.61 | 1948.1 | 482.5 | 479.63 | 477.06 |
| 15 | 430.66hi | 527.64fgh | 88 | 1.29 | 1957.95 | 483.66 | 480.64 | 474.25 |
| 14 | 432.33fgh | 538.66efg | 106.33 | 1.52 | 1959.74 | 485.5 | 481.04 | 479.83 |
| 29 | 444.66cd | 527.33fgh | 82.66 | 1.31 | 1978.05 | 486 | 484.00 | 482.31 |
| 33 | 438.64de | 538.33efg | 99.65 | 1.51 | 1990.15 | 488.5 | 485.24 | 483.41 |
| 32 | 431.31ghi | 551.66def | 120.32 | 1.79 | 2005.96 | 419.5 | 487.44 | 484.11 |
| 1 | 442.66cde | 541def | 98.33 | 1.5 | 2020.57 | 491.83 | 488.78 | 486.91 |
| 13 | 440cde | 546def | 106 | 1.61 | 2024.13 | 493 | 489.65 | 478.3 |
| 18 | 433.66efg | 553cde | 119.33 | 1.78 | 2020.89 | 493.33 | 489.00 | 486.11 |
| 27 | 460bc | 529.61fgh | 69.36 | 1.09 | 2058.6 | 494.83 | 493.48 | 492.23 |
| 16 | 435.33efg | 555cde | 119.36 | 1.56 | 2035.59 | 495.16 | 490.86 | 492.04 |
| 4 | 457.33bcd | 538efg | 80.66 | 1.29 | 2090.70 | 497.66 | 495.83 | 494.38 |
| 12 | 462bc | 536efg | 74 | 1.09 | 2115.87 | 499 | 497.31 | 496.25 |
| 31 | 488ab | 552def | 104 | 1.52 | 2019.90 | 500 | 496.74 | 496.56 |
| 17 | 445cd | 557.33bcde | 112.33 | 1.54 | 2095.65 | 501.16 | 497.54 | 495.03 |
| 25 | 446.66cd | 556bcde | 109.33 | 1.64 | 2097.14 | 501.31 | 498.16 | 495.86 |
| 9 | 445.33cd | 559.35abcd | 114 | 1.62 | 2112.88 | 502.33 | 498.44 | 495.86 |
| 36 | 454.33bcd | 551.66def | 97.36 | 1.44 | 2133.02 | 503 | 500.40 | 498.28 |
| 28 | 439.4de | 567.33abc | 129 | 1.37 | 2110.79 | 503.83 | 499.34 | 495.57 |
| 19 | 437.66ef | 576a | 141.32 | 1.98 | 2104.43 | 505.83 | 499.07 | 495.44 |
| 10 | 448cd | 564abd | 116 | 1.67 | 1228.97 | 506 | 501.82 | 999.35 |
| 21 | 464.66bc | 548.33def | 84.66 | 1.26 | 2141.7 | 506 | 503.64 | 503.03 |
| 11 | 449cd | 574.66a | 125.66 | 1.41 | 2176.97 | 511.83 | 507.63 | 504.11 |
| 6 | 478.66ab | 548def | 69.33 | 1.07 | 2227.49 | 513.33 | 512.065 | 510.98 |
| 37 | 488.61ab | 563.66abcd | 75 | 1.11 | 2335.89 | 526.16 | 524.75 | 523.45 |
| 39 | 501.33a | 574ab | 72.66 | 1.02 | 2433.43 | 537.66 | 536.047 | 525.56 |
| 38 | 510.33a | 586.33a | 76 | 1.015 | 2532.41 | 543.16 | 546.23 | 545.75 |
Table 3. Correlation tolerance and sensitivity indices based on grain yield in drought stress conditions desir-able environment
| YP | YS | SSI | TOL | MP | GMP | STI | |
|---|---|---|---|---|---|---|---|
| YP | 1 | 0.239 | **0.781 | *0.199 | **0.178 | **0.881 | **0.471 |
| YS | 1 | **-0.324 | **-0.238 | **0.226 | **0.736 | **0.39 | |
| SSI | 1 | **0.225 | **0.460 | **0.398 | **0.379 | ||
| TOL | 1 | **0.541 | **0.480 | **0.462 | |||
| MP | 1 | **0.997 | **0.185 | ||||
| GMP | 1 | **0.999 | |||||
| STI | 1 |
Table 4. The correlation between sensitivity to drought tolerance indices and grain yield in both normal and drought conditions for the genotypes studied
| YP | YS | SSI | YSI | TOL | MP | GMP | STI | Yl | YSl | |
|---|---|---|---|---|---|---|---|---|---|---|
| YP | 1 | .239 | .781** | -.574** | .199* | .178** | .881** | .471** | .356ns | -542** |
| YS | 1 | -.324** | .467** | -.238** | .226** | .736** | .39** | .967** | .487* |
YP: yield in normal condition, YS: yield stress, SSI: stress susceptibility index, TOl: Tolerance, STI, Average productivity (MP), GMP: Geometric mean productivity and YSI: Index Sustainability Performance
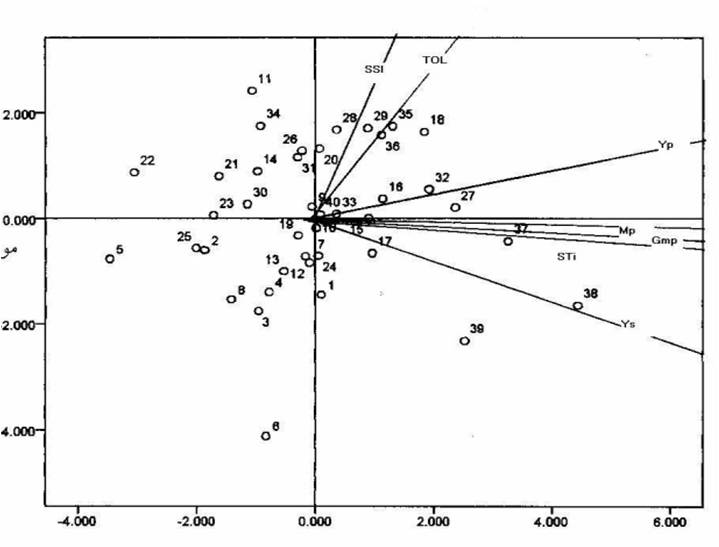
Fig 1 Traced graphics Biplot drought tolerance indices and bread wheat cultivars based on the first two components
REFERENCES
- Ahmadi, C., Zeynali monastery, M. Rostami V.chvgan 1379 drought resistance indices and using hybrid corn Biplot in the Journal of Agricultural Sciences Iran. JLD 31, 3.
- The Ministry of Agriculture statistics 1390, Office of Planning and the Ministry of Agriculture.
- Soul, A., M, thirty-three dead hsamy.1382: Different growth factors and introducing drought resistant cultivars for use in breeding programs dry land wheat seam Kurdistan. MJMV Conference, University.
- Fischer, R.A., and Maurer, R. 1978. Drought resistance in spring wheat cultivar I: Grain yield responses. Austr. J. Agric. Res. 29: 897-912.
- Fernandez, G. C. J. 1992. Effective selection criteria for assessing stress tolerance. P proceeding of Crop Symposium, 13-18, Taiwan, pp: 257-270.
- Panthuwan, G., Fukaim S., Cooper, M ., Rajatasereekul ,S. and Otoole ,J. C. 2002.Yield respond of rice (oriza sativa L) genotype to different types of drought under rain fed low lands. Part I. Grain yield and yield components. Field Crops Research 73:153-197.
- Rosielle, A.T. & J. Hambelen, 1981; Theoricale aspect of selection for yield in stress and non-stress environment. Crop Sci. 21: P, 493.
- Falahi , H. A., A; at Jafarbai ,J.and sayedi,F.2011. Evalua-tion of drought tolerance in durum wheat (triticum aestivum L) genotypes using drought tolerance indices. Seed and plant Improvement journal 27-1(1):115-22 (in Persian).
- Gabriel, K. R. 1971. The biplot graphical display of matrices whit applications to principal component analysis. Biometrical 58:453-467.
- Sio-Se Mardeh, A., Ahmadi, A., Poustini, K., and Mohammadi, V. 2006. Evaluation of drought resistance indices under various environmental conditions. Field Crop Res. 98: 222-229.
- Gravandi, M., Farshadfar, E. A. and Kahrizi, D. 2010. Evaluation of durum wheat tolerance in bread wheat advanced genotypes in field and laboratory conditions. Seed and Plant Improvement Journal 26-1(2):223-252 (in Persian).
- Soleymanifard, A, Fasihi, KH., Nasrirad , H. and Naseri,R.2010.Evaluation of stress tolerance indices in durum wheat genotypes. Journal of plant Production 17(2):39-58 (in Persian).
| Source of Financial Support: Nil Conflict of interest: Nil |
Ā
| International Journal of Life-Sciences Scientific Research (IJLSSR) Open Access Policy Authors/Contributors are responsible for originality, contents, correct references, and ethical issues. IJLSSR publishes all articles under Creative Commons Attribution- Non-Commercial 4.0 International License (CC BY-NC). https://creativecommons.org/licenses/by-nc/4.0/ |
Ā