Key-Words- Seaweed, Indian Sundarbans, Proximate composition, ANOVA, Seasonal variation
INTRODUCTION- Marine algae or seaweeds are macroscopic and non flowering thallophytic plants. They are attached to rocks, corals and other submerged strata in the coastal regions, river mouth and estuaries. They are also found on the pneumatophores (specialized roots of mangrove species that grow upward out of water or mud to obtain oxygen for the trees in tidal regions), trunk of mangrove trees and other hard substrata like boulders, sluice gate etc. Although structurally dissimilar from higher plants, yet they produce own food through photosynthesis by their substitute organs (holdfast, stipe and blade). They are mainly used as raw materials in different industries like food, cosmetics, paint, crop, textile, paper, rubber etc [1-3].
Seaweeds are considered as a part of healthy diet because it contains beneficial nutrients like protein, vitamins, minerals, antioxidants etc [4]. According to many researchers seaweeds are good sources of antioxidants [5-6].
Indian Sundarbans is a mangrove dominated Gangetic delta (Fig 1) in the north east coast of Indian sub-continent which sustains some 34 species of true mangroves along with several seaweed species [3,7]. The three seaweed species Enteromorpha intestinalis, Ulva lactuca and Catenella repens are dominantly found in Indian Sundarbans. The present study aimed to analyse the proximate composition of these three seaweed species collected from three stations in Indian Sundarbans through seasons during 2014-15 along with the hydrological parameters to which these seaweed species are exposed to through tidal actions.
MATERIALS AND METHODS
Sampling site- The Indian Sundarbans at the apex of the Bay of Bengal (between 21∞30'N to 22∞30'N latitude and 87∞25'E to 89∞10'E longitude) is located on the southern fringe of the state of West Bengal (a maritime State in the northeast coast of India). The Sundarban Biosphere Reserve (SBR) occupies an area of about 9630 sq. km, of which the forest area is about 4200 sq. km. The region is demarcated by Bangladesh in the East, the Hooghly River in the West, the Dampier and Hodges line in the North and the Bay of Bengal in the South. With a considerable degree of marine characteristics in major portion of the ecosystem, the important geomorphologic features of deltaic Sundarbans are beaches, mudflats, coastal dunes, sand flats, estuaries, creeks, inlets and mangrove swamps [8] (Fig 1).
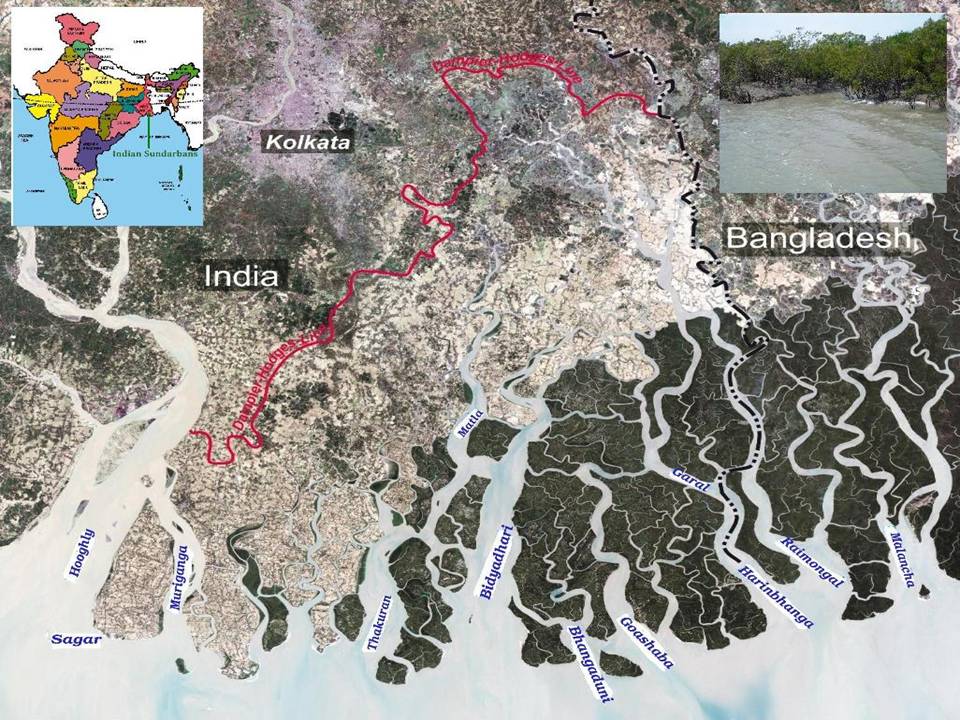
Fig 1: Map of Indian Sundarbans
Sample collection- Three species (E. intestinalis, U. lactuca and C. repens.) were collected from the hard substrata (preferably exposed jetties during low tide) at each station and thoroughly washed with ambient water and then double distilled water and brought to the laboratory in ice-freezed condition for further analysis.
Analysis of hydrological parameters- The surface water temperature was instantly measured by using portable thermometer after water collection. Surface water salinity was recorded by means of an optical refractometer (Atago, Japan) in the field and cross-checked in laboratory by employing Mohr-Knudsen method [9]. Portable pH meter (which has an accuracy of ±0.01) was used for recording the surface water pH. Dissolved oxygen was measured by DO meter in the field and subsequently cross checked in the laboratory by Winklerís method [10]. Dissolved nutrients (nitrate, phosphate and silicate) were analyzed in the laboratory as per the standard method [9].
Analysis of proximate composition- The collected fresh seaweed samples were dried in hot air oven at 105∞C for 6 hrs and then the difference in weight was recorded for moisture content [11]. The ash content of the each dried sample was analyzed by burning at 550∞C for 6 hours in a Muffle furnace ac-cording to the standard method [11].
The protein content in each seaweed species was es-timated by Lowry method [12]. The analysis of total carbohydrate was done by using phenol-sulphuric acid and then calculated from standard glucose curve [13]. Fat was determined by Soxhlet method as per the standard protocol [14]. The organic solvent extract from each sample was used in spec-trophotometer for the analysis of astaxanthin [15]. All of the biochemical parameters were expressed as the percentage dry weight except astaxanthin, which was expressed in ppm dry weight.
STATISTICAL ANALYSIS- Analysis of Variance (ANOVA) was performed through SPSS 16.0 to assess whether all the selected hydrological parameters and biochemical parameters varied significantly between stations and seasons; possibilities less than 1% (p < 0.01) were considered statistically significant. Data of proximate composition were subject to analysis of correlation coefficient (r) in order to evaluate the inter-relationships between biochemical parameters of each selected species with the selected hydrological parameters.
RESULTS- The results of the hydrological analysis of the three selected stations are presented in Fig 2. The surface water temperature varied from 29.8∞C (in Gosaba during postmonsoon) to 34.5∞C (in Jharkhali during premonsoon). The values of surface water salinity and pH were observed between 18.9 psu (in Gosaba during monsoon) and 30.1 psu (in Jharkhali during premonsoon), 8.29 (in Gosaba during monsoon) and 8.32 (in Jharkhali during premonsoon) respectively. The minimum level of DO was observed during premonsoon (4.75 ppm in Jharkhali) and maximum was observed during monsoon (5.44 ppm in Gosaba). The dissolved nutrient levels in three selected stations during three seasons are shown in Fig 3. The dissolved nitrate and phosphate ranged from 17.11 µgat l-1 (in Bali Island during premonsoon) to 29.1 µgat l-1 (in Jharkhali during monsoon) and 2.03 µgat l-1 (in Bali Island during premonsoon) to 4.66 µgat l-1 (in Jharkhali during monsoon) respectively. The dissolved silicate varied from 54.29 µgat l-1 (in Bali Island during premonsoon) to 83.14 µgat l-1 (in Jharkhali during monsoon).
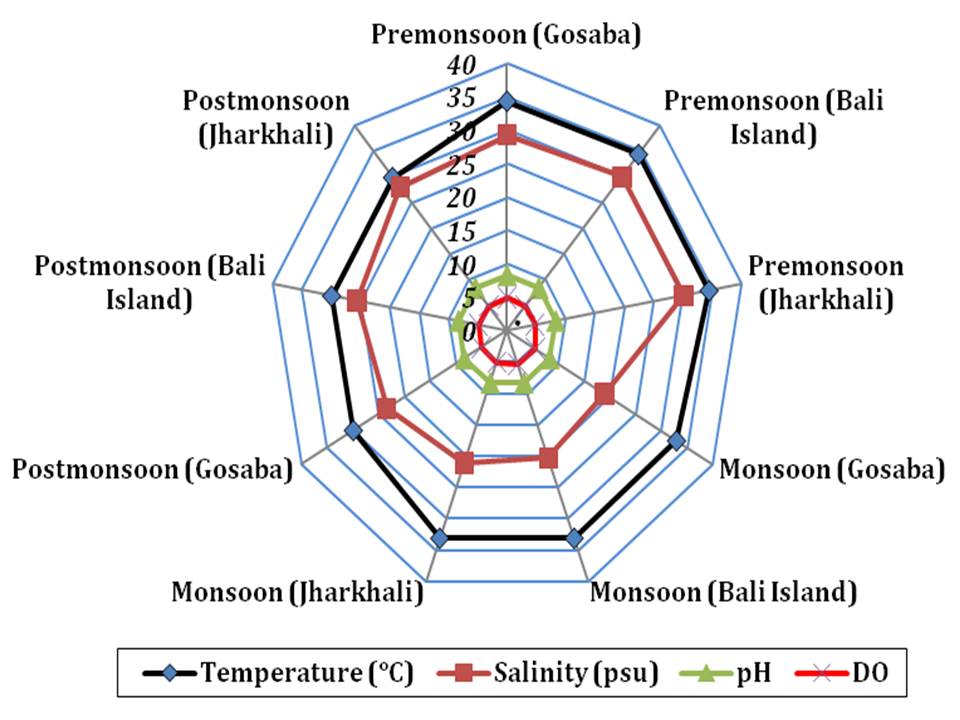
Fig 2: Spatio-temporal result of four hydrological parameters during study period
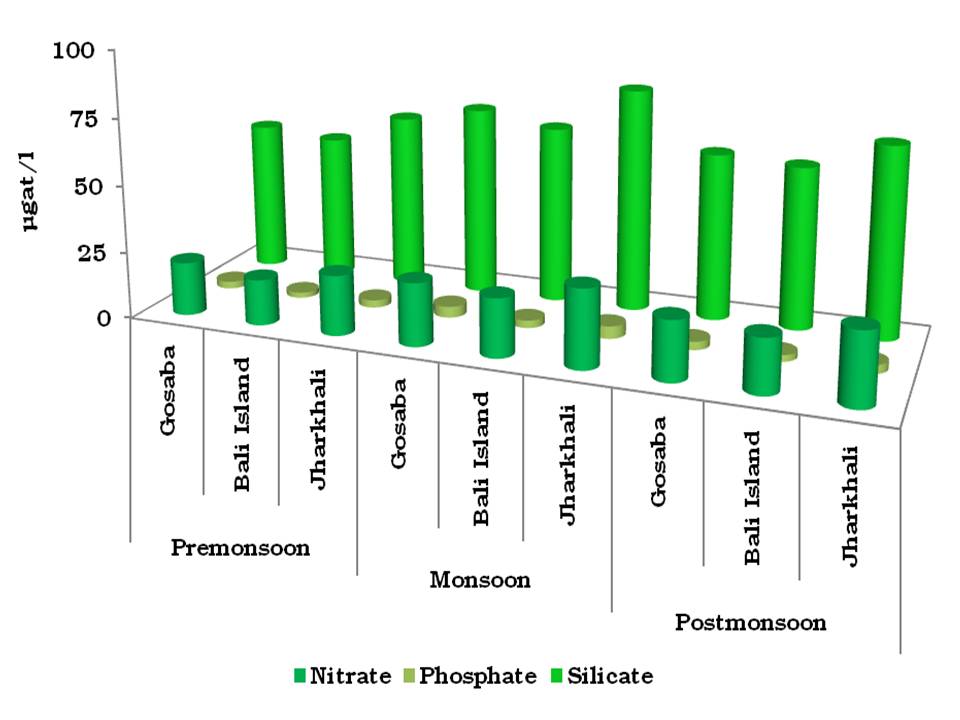
Fig 3: Concentrations of dissolved nutrients (in µgat l-1) of three selected stations through three seasons
The ash content varied between 12.15 % (in Gosaba during monsoon) and 17.51 % (in Jharkhali during premonsoon) in E. intestinalis, 11.47 % (in Gosaba dur-ing monsoon) and 16.20 % (in Jharkhali during pre-monsoon) in U. lactuca and 14.23 % (in Gosaba during monsoon) and 19.01 % (in Jharkhali during premon-soon) in C. repens..
Fig 4 represents the proximate composition of the three selected seaweed species. The protein percentage varied from 5.03 (in C. repens. in Jharkhali during premonsoon) to 10.64 (in U. lactuca in Gosaba during monsoon). The range of carbohydrate was from 29.42 % (in C. repens. in Gosaba during monsoon) to 55.76 % (in E. intestinalis in Jharkhali during premonsoon). The fat content varied between 0.09 % (in C. repens. in Jharkhali during premonsoon) and 0.74 % (in U. lactuca in Gosaba during postmonsoon). The maximum amount of astaxanthin was observed in C. repens. (257.90 ppm dry weight in Jharkhali during premon-soon) and minimum was in E. intestinalis (163.22 ppm dry weight in Gosaba during monsoon) which is shown in Fig 5.
The average percentage of protein was highest in E. intestinalis (9.67 %) followed by U. lactuca (8.77 %) and C. repens. (7.1 %). The same order was also followed for carbohydrate content with average value 44.71 %, 37.87 % and 31.45 % in E. intestinalis, U. lactuca and C. repens. respectively. The average fat content followed the order U. lactuca (0.38 %) > E. intestinalis (0.22 %) > C. repens. (0.16 %). The average value of astaxanthin was highest in C. repens. (229.08 ppm dry weight) followed by U. lactuca (192.31 ppm dry weight) and E. intestinalis (181.76 ppm dry weight).
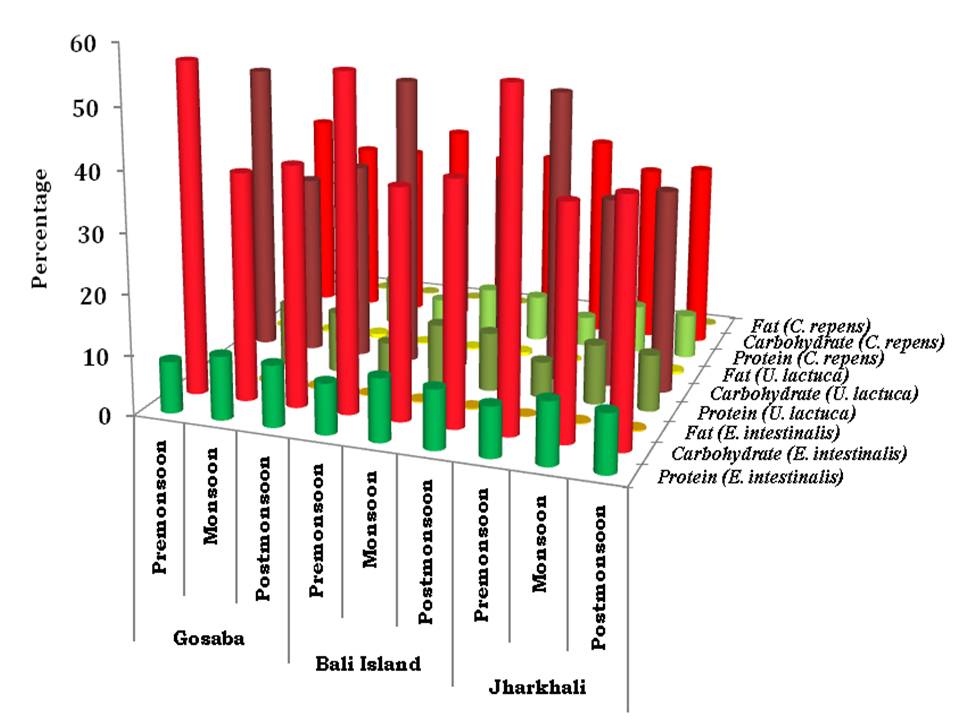
Fig 4: Concentrations of protein, carbohydrate and fat (in %) of the three selected seaweeds of three se-lected stations through seasons
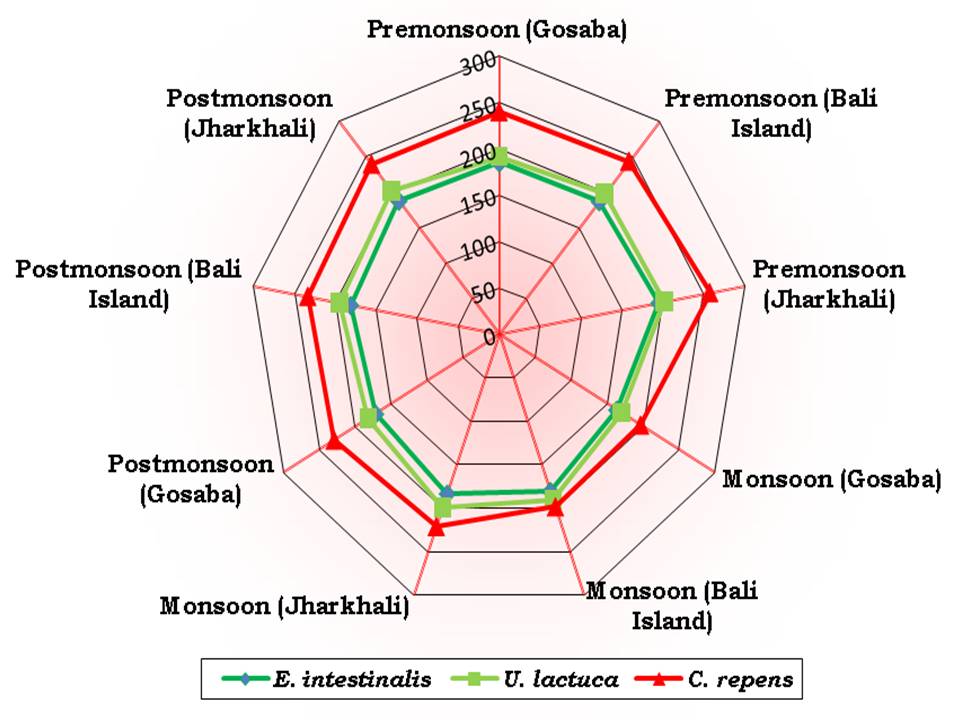
Fig 5: Concentration of astaxanthin (ppm dry weight) of three selected seaweeds of three selected stations through seasons
The moisture content in all the selected seaweed species was found to be highest during monsoon and lowest during premonsoon. High temperature during premonsoon causes more transpiration which may be attributed to the less moisture content in all the seaweed species. The seasonal order of the percentage of ash content was completely opposite to the moisture content in all the selected species. Previous studies have reported that ash content of seaweed varies between 8 and 40% [18], which are similar to the range observed in the present study.
The present study also confirms significant effects of the hydrological parameters on the proximate composition of selected seaweeds species (Table 1). The significant positive correlation between surface water temperature and carbohydrate for all stations reflects the enhancement of photosynthesis due to increase of solar radiation that is reflected through surface water temperature. The significant negative correlation between surface water temperature and protein level reflects the denaturation of protein at high temperature. In fact the peptide bonds are broken at elevated temperature. The significant negative correlation between surface water temperature and fat may be the result of dissolution of fat at higher temperature. The surface water temperature showed strong correlation with astaxanthin level (except at Bali Island).
The impact of salinity on the proximate composition of selected seaweeds was also pronounced. The significant positive correlation between ambient aquatic salinity and carbohydrate indicates that the selected seaweed species are capable of performing the process of photosynthesis in all salinity gradients. The picture is however negative for protein. Such observations were recorded by earlier workers in the same geographical locale [1]. The significant positive correlations between ambient aquatic salinity and astaxanthin of the selected seaweeds conclude that the stress posed by hypersaline condition accelerate the synthesis of astaxanthin.
The aquatic pH exhibited significant positive correla-tions with carbohydrate and astaxanthin content of the selected seaweeds. However, high pH exhibited an ad-verse impact on the protein content of the seaweed species.
The selected dissolved nutrients exhibited significantly positive correlations with protein content of the sea-weeds. The protein concentration in marine organism depends on the dissolved nutrients [19-20]. The highest percentage of protein in seaweeds during monsoon might be attributed to the accumulation of more nitrogen from organic wastes brought to the estuaries and coastal waters by the land run-off [1,21-23] (Fig 4).
The presence of nutrients enriched sewage increases the turbidity of water due to which the photosynthesis is adversely affected. This is confirmed through significant negative correlations between nitrate and carbohydrate, phosphate and carbohydrate, silicate and carbohydrate.
ANOVA carried on the observed data reflects pro-nounced variations of all hydrological parameters except surface water temperature and salinity between stations (Table 2). This is due to the fact that all the selected stations are located in the central Indian Sundarbans, where the salinity profile is almost similar. Pronounced seasonal variations were observed for all the selected hydrological parameters (Table 2). In the domain of proximate composition, ANOVA results exhibit pronounced variations between stations and seasons (except carbohydrate in U. lactuca and C. repens. between stations and astaxanthin in U. lactuca between seasons) (Table 3). This may be attributed to spatio-temporal variations of most of the hydrological parameters in the study area, which is a characteristic feature of Indian Sundarbans [2-3,8,24-25].
The overall discussion thus directs us to conclude that the water quality of this mangrove dominated World Heritage Site must be monitored and managed on regular basis to maintain optimum proximate composition of seaweeds, which may be a source of food for the future world.
CONCLUSION- Seaweeds in the lower Gangetic delta region are rich in protein and carbohydrates and can be a source of food. Considerable spatio-temporal variations are witnessed for proximate composition of the seaweeds, irrespective of species. Ambient hydrological parameters have regu-latory influences on the proximate composition of the selected seaweed species.
Table 1 Inter-relationships between biochemical parameters of selected three seaweed species and hydrological parameters in three selected stations
| Stn. 1 | Stn. 2 | Stn. 3 | Stn. 1 | Stn. 2 | Stn. 3 | |
|---|---|---|---|---|---|---|
| E. intestinalisprotein x SWT | -0.6232 | -0.5082 | -0.5135 | <0.01 | <0.01 | <0.01 |
| E. intestinalisprotein x SWS | -0.9592 | -0.9616 | -0.8714 | <0.01 | <0.01 | <0.01 |
| E. intestinalisprotein x pH | -0.6312 | -0.7331 | -0.9772 | <0.01 | <0.01 | <0.01 |
| E. intestinalisprotein x DO | 0.6990 | 0.8569 | 0.8928 | <0.01 | <0.01 | <0.01 |
| E. intestinalisprotein x D. NO3 | 0.9719 | 0.9973 | 0.9991 | <0.01 | <0.01 | <0.01 |
| E. intestinalisprotein x D. PO4 | 0.8257 | 0.9877 | 0.8703 | <0.01 | <0.01 | <0.01 |
| E. intestinalisprotein x D. SiO3 | 0.9341 | 0.9897 | 0.9162 | <0.01 | <0.01 | <0.01 |
| E. intestinaliscarbohydrate x SWT | 0.6631 | 0.6585 | 0.6767 | <0.01 | <0.01 | <0.01 |
| E. intestinaliscarbohydrate x SWS | 0.9432 | 0.8944 | 0.7540 | <0.01 | <0.01 | <0.01 |
| E. intestinaliscarbohydrate x pH | 0.5899 | 0.5949 | 0.9139 | <0.01 | <0.01 | <0.01 |
| E. intestinaliscarbohydrate x DO | -0.6608 | -0.7470 | -0.7831 | <0.01 | <0.01 | <0.01 |
| E. intestinaliscarbohydrate x D. NO3 | -0.9583 | -0.9669 | -0.9700 | <0.01 | <0.01 | <0.01 |
| E. intestinaliscarbohydrate x D. PO4 | -0.7952 | -0.9418 | -0.7525 | <0.01 | <0.01 | <0.01 |
| E. intestinaliscarbohydrate x D. SiO3 | -0.9142 | -0.9990 | -0.8161 | <0.01 | <0.01 | <0.01 |
| E. intestinalisfat x SWT | -0.8796 | -0.8467 | -0.9554 | <0.01 | <0.01 | <0.01 |
| E. intestinalisfat x SWS | -0.7721 | -0.7286 | -0.3206 | <0.01 | <0.01 | IS |
| E. intestinalisfat x pH | -0.2773 | -0.3394 | -0.5852 | IS | IS | <0.01 |
| E. intestinalisfat x DO | 0.3634 | 0.5249 | 0.3633 | IS | <0.01 | IS |
| E. intestinalisfat x D. NO3 | 0.8024 | 0.8531 | 0.7155 | <0.01 | <0.01 | <0.01 |
| E. intestinalisfat x D. PO4 | 0.5391 | 0.8059 | 0.3185 | <0.01 | <0.01 | IS |
| E. intestinalisfat x D. SiO3 | 0.7199 | 0.9449 | 0.4140 | <0.01 | <0.01 | IS |
| E. intestinalisastaxanthin x SWT | 0.4212 | 0.5695 | 0.4206 | IS | <0.01 | IS |
| E. intestinalisastaxanthin x SWS | 0.9988 | 0.9391 | 0.9181 | <0.01 | <0.01 | <0.01 |
| E. intestinalisastaxanthin x pH | 0.7963 | 0.6816 | 0.9940 | <0.01 | <0.01 | <0.01 |
| E. intestinalisastaxanthin x DO | -0.8479 | -0.8171 | -0.9352 | <0.01 | <0.01 | <0.01 |
| E. intestinalisastaxanthin x D. NO3 | -1.0000 | -0.9894 | -0.9979 | <0.01 | <0.01 | <0.01 |
| E. intestinalisastaxanthin x D. PO4 | -0.9355 | -0.9737 | -0.9172 | <0.01 | <0.01 | <0.01 |
| E. intestinalisastaxanthin x D. SiO3 | -0.9919 | -0.9975 | -0.9532 | <0.01 | <0.01 | <0.01 |
| U. lactucaprotein x SWT | -0.6781 | -0.6866 | -0.6533 | <0.01 | <0.01 | <0.01 |
| U. lactucaprotein x SWS | -0.9363 | -0.8768 | -0.7742 | <0.01 | <0.01 | <0.01 |
| U. lactucaprotein x pH | -0.5735 | -0.5639 | -0.9262 | <0.01 | <0.01 | <0.01 |
| U. lactucaprotein x DO | 0.6455 | 0.7211 | 0.8022 | <0.01 | <0.01 | <0.01 |
| U. lactucaprotein x D. NO3 | 0.9524 | 0.9565 | 0.9771 | <0.01 | <0.01 | <0.01 |
| U. lactucaprotein x D. PO4 | 0.7828 | 0.9284 | 0.7728 | <0.01 | <0.01 | <0.01 |
| U. lactucaprotein x D. SiO3 | 0.9058 | 0.9967 | 0.8338 | <0.01 | <0.01 | <0.01 |
| U. lactucacarbohydrate x SWT | 0.6290 | 0.6523 | 0.6673 | <0.01 | <0.01 | <0.01 |
| U. lactucacarbohydrate x SWS | 0.9571 | 0.8980 | 0.7623 | <0.01 | <0.01 | <0.01 |
| U. lactucacarbohydrate x pH | 0.6254 | 0.6014 | 0.9190 | <0.01 | <0.01 | <0.01 |
| U. lactucacarbohydrate x DO | -0.6936 | -0.7524 | -0.7909 | <0.01 | <0.01 | <0.01 |
| U. lactucacarbohydrate x D. NO3 | -0.9701 | -0.9689 | -0.9730 | <0.01 | <0.01 | <0.01 |
| U. lactucacarbohydrate x D. PO4 | -0.8215 | -0.9445 | -0.7608 | <0.01 | <0.01 | <0.01 |
| U. lactucacarbohydrate x D. SiO3 | -0.9314 | -0.9994 | -0.8234 | <0.01 | <0.01 | <0.01 |
| U. lactucafat x SWT | -0.9966 | -0.9982 | -0.9990 | <0.01 | <0.01 | <0.01 |
| U. lactucafat x SWS | -0.4517 | -0.1940 | 0.0176 | IS | IS | IS |
| U. lactucafat x pH | 0.1320 | 0.2713 | -0.2773 | IS | IS | IS |
| U. lactucafat x DO | -0.0415 | -0.0683 | 0.0277 | IS | IS | IS |
| U. lactucafat x D. NO3 | 0.4950 | 0.3901 | 0.4380 | IS | IS | IS |
| U. lactucafat x D. PO4 | 0.1553 | 0.3109 | -0.0199 | IS | IS | IS |
| U. lactucafat x D. SiO3 | 0.3803 | 0.5779 | 0.0828 | IS | <0.01 | IS |
| U. lactucaastaxanthin x SWT | 0.2438 | 0.1640 | -0.0492 | IS | IS | IS |
| U. lactucaastaxanthin x SWS | 0.9902 | 0.9959 | 0.9971 | <0.01 | <0.01 | <0.01 |
| U. lactucaastaxanthin x pH | 0.8956 | 0.9288 | 0.9306 | <0.01 | <0.01 | <0.01 |
| U. lactucaastaxanthin x DO | -0.9323 | -0.9851 | -0.9926 | <0.01 | <0.01 | <0.01 |
| U. lactucaastaxanthin x D. NO3 | -0.9822 | -0.9565 | -0.8541 | <0.01 | <0.01 | <0.01 |
| U. lactucaastaxanthin x D. PO4 | -0.9851 | -0.9777 | -0.9973 | <0.01 | <0.01 | <0.01 |
| U. lactucaastaxanthin x D. SiO3 | -0.9981 | -0.8720 | -0.9845 | <0.01 | <0.01 | <0.01 |
| C. repens.protein x SWT | -0.5977 | -0.6527 | -0.6090 | <0.01 | <0.01 | <0.01 |
| C. repens.protein x SWS | -0.9679 | -0.8979 | -0.8092 | <0.01 | <0.01 | <0.01 |
| C. repens.protein x pH | -0.6560 | -0.6011 | -0.9463 | <0.01 | <0.01 | <0.01 |
| C. repens.protein x DO | 0.7218 | 0.7521 | 0.8350 | <0.01 | <0.01 | <0.01 |
| C. repens.protein x D. NO3 | 0.9791 | 0.9688 | 0.9877 | <0.01 | <0.01 | <0.01 |
| C. repens.protein x D. PO4 | 0.8436 | 0.9444 | 0.8078 | <0.01 | <0.01 | <0.01 |
| C. repens.protein x D. SiO3 | 0.9452 | 0.9994 | 0.8641 | <0.01 | <0.01 | <0.01 |
| C. repens.carbohydrate x SWT | 0.7193 | 0.5827 | 0.5800 | <0.01 | <0.01 | <0.01 |
| C. repens.carbohydrate x SWS | 0.9146 | 0.9335 | 0.8298 | <0.01 | <0.01 | <0.01 |
| C. repens.carbohydrate x pH | 0.5255 | 0.6698 | 0.9573 | <0.01 | <0.01 | <0.01 |
| C. repens.carbohydrate x DO | -0.6006 | -0.8078 | -0.8543 | <0.01 | <0.01 | <0.01 |
| C. repens.carbohydrate x D. NO3 | -0.9333 | -0.9870 | -0.9927 | <0.01 | <0.01 | <0.01 |
| C. repens.carbohydrate x D. PO4 | -0.7458 | -0.9699 | -0.8285 | <0.01 | <0.01 | <0.01 |
| C. repens.carbohydrate x D. SiO3 | -0.8800 | -0.9985 | -0.8816 | <0.01 | <0.01 | <0.01 |
| C. repens.fat x SWT | -0.9562 | -0.9366 | -0.9514 | <0.01 | <0.01 | <0.01 |
| C. repens.fat x SWS | -0.6315 | -0.5757 | -0.3334 | <0.01 | <0.01 | |
| C. repens.fat x pH | -0.0822 | -0.1429 | -0.5960 | <0.01 | IS | <0.01 |
| C. repens.fat x DO | 0.1723 | 0.3426 | 0.3758 | IS | IS | IS |
| C. repens.fat x D. NO3 | 0.6688 | 0.7305 | 0.7249 | <0.01 | <0.01 | <0.01 |
| C. repens.fat x D. PO4 | 0.3623 | 0.6701 | 0.3312 | IS | <0.01 | IS |
| C. repens.fat x D. SiO3 | 0.5687 | 0.8595 | 0.4263 | <0.01 | <0.01 | IS |
| C. repens.astaxanthin x SWT | 0.0234 | -0.0159 | 0.3237 | IS | IS | IS |
| C. repens.astaxanthin x SWS | 0.9348 | 0.9635 | 0.9545 | <0.01 | <0.01 | <0.01 |
| C. repens.astaxanthin x pH | 0.9718 | 0.9803 | 1.0000 | <0.01 | <0.01 | <0.01 |
| C. repens.astaxanthin x DO | -0.9892 | -1.0000 | -0.9670 | <0.01 | <0.01 | <0.01 |
| C. repens.astaxanthin x D. NO3 | -0.9163 | -0.8885 | -0.9859 | <0.01 | <0.01 | <0.01 |
| C. repens.astaxanthin x D. PO4 | -0.9987 | -0.9241 | -0.9538 | <0.01 | <0.01 | <0.01 |
| C. repens.astaxanthin x D. SiO3 | -0.9598 | -0.7699 | -0.9796 | <0.01 | <0.01 | <0.01 |
Stn. 1: Gosaba; Stn. 2: Bali Island; Stn. 3: Jharkhali; SWT: Surface Water Temperature; SWS: Surface Water Sa-linity; DO: Dissolved oxygen; D. NO3: Dissolved Nitrate; D. PO4: Dissolved Phosphate; D. SiO3: Dissolved Silicate
Table 2 Spatio temporal variations of hydrological parameters
| Parameters | Variables | Fcal | Fcrit |
|---|---|---|---|
| Temperature | Between Stations | 4 | 6.944 |
| Between Seasons | 4773 | ||
| Salinity | Between Stations | 5.144 | |
| Between Seasons | 75.529 | ||
| pH | Between Stations | 13 | |
| Between Seasons | 13 | ||
| DO | Between Stations | 8.702 | |
| Between Seasons | 29.570 | ||
| Dissolved Nitrate | Between Stations | 46.299 | |
| Between Seasons | 27.490 | ||
| Dissolved Phosphate | Between Stations | 10.339 | |
| Between Seasons | 14.408 | ||
| Dissolved Silicate | Between Stations | 44.030 | |
| Between Seasons | 53.645 |
Table 3 Spatio temporal variation of proximate composition
| Species | Variables | Fcrit | ||||
|---|---|---|---|---|---|---|
| Protein | Carbohydrate | Fat | Astaxanthin | |||
| E. intestinalis | Between Stations | 9.253 | 53.769 | 8 | 12.095 | 6.944 |
| Between Seasons | 404.652 | 134058.9 | 182 | 9.792 | ||
| U. lactuca | Between Stations | 24.911 | 4.54 | 8.622 | 12.594 | |
| Between Seasons | 1200.136 | 2037.156 | 74.235 | 3.688 | ||
| C. repens. | Between Stations | 7.914 | 5.745 | 13.818 | 11.884 | |
| Between Seasons | 151.536 | 155.715 | 86.364 | 62.498 | ||
REFERENCES
- Banerjee K, Ghosh R, Homechaudhuri S and Mitra A. Biochemical composition of marine macroalgae from Gangetic Delta at the apex of Bay of Bengal. Afr J Basic Appl Sci, 2009; 1(5-6): 96-104.
- Mitra A and Zaman S. Blue carbon reservoir of the blue planet, published by Springer, 2015.
- Mitra A and Zaman S. Basics of Marine and Estuarine Ecology, Springer, 2016.
- Athukorala Y, Kim KN and Jeon YJ. Anti-proliferative and antioxidant properties of an enzymatic hydrolysate from brown alga, Ecklonia cava. Food Chem Toxicol, 2016; 44: 1065-1074.
- Chandini SK, Ganesan P and Bhaskar N. In vitro anti-oxidant activities of three selected brown seaweeds of India. Food Chem, 2008; 107: 707-713.
- Cox S, Abu-Ghannam N and Gupta S. An assessment of the antioxidant and antimicrobial activity of six species of edible Irish seaweeds. Int Food Res J, 2009; 17: 205-220.
- Mitra A. The Northeast coast of the Bay of Bengal and deltaic Sundarbans. In: Seas at the Millennium ñ An environ mental evaluation, Chapter 62 (Editor: Charles Sheppard, University of Warwick, Coventry, UK), Elsevier Science: 2000, pp 143-157.
- Mitra A. In: Sensitivity of Mangrove ecosystem to changing Climate. Springer; 2013: pp. 323.
- Strickland IDH and Parsons TR. A Practical Handbook of Seawater Analysis. 2nd Edn., Fisheries Research Board of Canada, Ottawa, 1972: pp 310.
- Winkler LW. Die Bestimmung des in Wasser gelˆsten Sauerstoffen. Berichte der Deutschen Chemischen Gesellschaft, 1888; 21: 2843ñ2855.
- AOAC. Association of Official Analytical Chemists. 17th Edn., Official Method of Analysis, Washington D.C., USA: 2000.
- Lowry OH, Rosebrough NJ, Farr AL and Randall RJ. Protein measurement with folin phenol reagent. J Biol Chem, 1951; 193: 265-275.
- Dubois M, Gilles KA, Hamilton JK, Rebers PA and Smith F. Colorimetric method for determination of sugars and related substances. Anal Chem, 1956; 28: 350-356.
- Folch J, Lees M and Sloane Stanley GH. A Simple Method for the Isolation and Purification of Total Lipides from Animal Tissues. J Biol Chem, 1957; 497-509.
- Schuep W and Schierle J. Astaxanthin Determination of stabilized, added astaxanthin in fish feeds and pre-mixes. In: Carotenoids Isolation and Analysis, 1A, 1995; pp 273-276.
- Marinho-Soriano E, Fonseca PC, Carneiro MAA and Moreira WSC. Seasonal variation in the chemical composition of two tropical seaweeds. Bioresour Technol, 2006; 97: 2402ñ2406.
- Murakami K, Yamaguchi Y, Noda K, Fujii T, Shinohara N, Ushirokawa T, Sugawa-Katayama Y and Katayama M. Seasonal variation in the chemical composition of a marine brown alga, Sargassum horneri (Turner) C. Agardh. J Food Comp Anal, 2011; 24: 231ñ236.
- Mabeau S and Fleurence J. Seaweed in food products: Biochemical and nutritional aspects. Trends Food Sci Tech, 1993; 4: 103-107.
- Joshi GV and Gowda CA. Seasonal variations in chemical composition of Sargassum ilicifolium Grun. and sea water. Indian J Mar Sci, 1975; 4: 165ñ168.
- Solimabi DB, Kamat SY, Fernandes L and Reddy CVG. Seasonal changes in carrageenan and other biochemical constituents of Hypnea musciformis. Indian J Mar Sci, 1980; 9: 134-136.
- Dhargalkar VK, Jagtap TG and Untawale AG. Biochemical constituents of seaweeds along the Maharastra coast. Indian J Mar Sci, 1980; 9(4): 297-299.
- Sarma VV, Raju GRK and Bose Babu T. Pollution characteristics and water quality in Visakhapatnam harbor. Mahasagar-Bull Natn Inst Oceanogr, 1982; 15: 15-22.
- Venkataraman K. Biochemical constituents of marine algae from Tuticorin coast. Indian J Mar Sci, 1993; 22: 138-140.
- Mitra A, Gangopadhyay A, Dube A, Andre CK Schmidt and Banerjee K. Observed changes in water mass properties in the Indian Sundarbans (Northwestern Bay of Bengal) during 1980 - 2007. Curr Sci, 2009; 97(10): 1445-1452.
- Mitra A and Zaman S. Carbon Sequestration by Coastal Floral Community; published by The Energy and Resources Institute (TERI) TERI Press, India, 2014.
| Source of Financial Support: Nil Conflict of interest: Nil |
Ý
|---|
| International Journal of Life-Sciences Scientific Research (IJLSSR) Open Access Policy Authors/Contributors are responsible for originality, contents, correct references, and ethical issues. IJLSSR publishes all articles under Creative Commons Attribution- Non-Commercial 4.0 International License (CC BY-NC). https://creativecommons.org/licenses/by-nc/4.0/ |
Ý
|---|