ABSTRACT-
Dumpsites exist throughout the developing countries present a threat to human health for the next several
years; this is because most of these countries follow the practice of open dumping of solid wastes. Most of these dumping
sites are uncontrolled and years old, having grown over time from small dumps to large, unmanaged waste sites.
Municipal waste, which is the most common source of the waste which ends up at the dumpsites, has been shown to
contain heavy metals which are leached out from the sites into the soil and water. This constitutes serious health and
environmental concerns because of the effects on the host soils, crops, animal and human health. This research determined
the level of heavy metals in the soil and water samples collected around Kadhodeki dumpsite. Heavy metal determination
from samples collected was carried out using X- ray fluorescence (XRF) analytical technique. The data was subjected to
statistical tests of significance using ANOVA and post hoc analysis by Tukeys test (P<0.05). The research found that V,
Mn, Cu, Co, Ni, Hg concentrations in the soil were higher than maximum allowable levels (MAL) for agricultural soils
while Fe, Zn levels were within the limits. The water was contaminated by higher levels of Mn (366-856 µg/l) and Fe
(5132-12402 µg/l) than allowed in drinking water while the level of Zn (40-336 µg/l) was below the World Health
Organization limits. Since subsistence farming was observed in the study area, then the study recommends that the
farmers growing edible crops around the site should be advised to stop doing so and instead be encouraged to grow other
crops that can provide some income and at the same time reclaim the land.
Key words: Dumpsites, Heavy metals, Contaminated soil, Contaminated water
INTRODUCTION
The last three decades have seen a worldwide concern over
the health effects caused by contamination and or pollution
of the environment. This is seen as result of the increase in
diseases burden all over the world. Most of the diseases
that are as a result of environmental contamination are not
easily diagnosed and are detected later in life. [1-2]
Very many old landfills and dumpsites exist throughout
developing countries, most them uncontrolled having
grown over time from small dumps to large, unmanaged
waste sites, with significant environmental and health risks.
[3-5]
Poor waste management strategies are a threat to the health
of those living in the cities, especially those residing near
the dumpsites because of dangers posed by water, soil, air,
vegetation and food contamination. Pollution of water
bodies with heavy metals from variety of sources is
becoming a matter of global concern because many water
resources have been rendered hazardous to man and other
living systems as a result of indiscriminate dumping of
refuse. [6-8] Studies have shown municipal waste contain
heavy metals which end up in soils and water as they are
leached out of the dumpsite. This may have potential
health implications on human and animal life due to
phytotoxicity of these metals to plants. [9-11]
Most of the heavy metals are extremely toxic because of
their solubility in water; they are known to accumulate in
living organisms, and even at low levels they can result in
long term cumulative health effects which are among the
leading health concerns all over the world. [12-16] This is
because heavy metals are non-biodegradable in nature,
have long biological half-lives and have potential to
accumulate in different body parts since there is no
effective mechanism for their elimination from the body.
Dumping of waste at Kadhodeki dumpsite located at the
fringes of Nairobi county started in 1986 as a way of filling
up the large gaping holes that had been left open after quarrying
activities in the construction of Nairobi/Waiyaki
highway. Land owners of the dumping area use the
dumpsite and soils around for farming and water from the
nearby Nairobi River is either used for irrigation or
domestic purposes without regard to the risk of toxic metal
pollution by the waste.
It is therefore in this understanding, that this study was undertaken.
The study sought to address part of this problem
by determining the concentration of these heavy metals in
soil and the water source found around the site.
MATERIALS AND METHODS
Study Location:
This study was carried out in Waithaka sub -location which
is in Dagoretti South Sub County, Nairobi County. Nairobi
County hosts the capital city of Kenya. It lies at an altitude
of 1,670 meters above sea level and occupies an area of 696
km2. The dumping activities have resulted in pollution of
the soils and the nearby fresh water source shown on the
map below as a blue line.
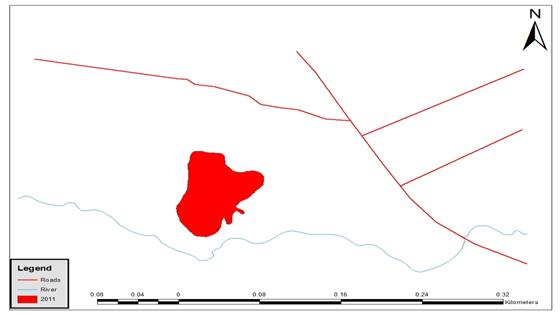
The coordinates for the study area are 1016'31.58"S, 36043'52.95"E (the red patch shows the area occupied by the dumpsite; all units are in square meters).
This research was analytical in nature involving the environmental media, sample collection, preparation and laboratory work. This involved the analysis of mean heavy metal concentrations in soil samples collected on and around the dumpsite. The first site was the control site which was at a point of 300m upstream along the nearby Nairobi River from where the dumpsite was located, the second site was next to the dumpsite and the third collection point was 300m downstream from where the dumpsite was located.
Soil sample collection and preparation: Four samples of the top soil at a depth of 15 cm were collected along each of the transect line upstream, midstream and downstream. [17] They were then air dried, crushed, passed through a sieve, put in clean polythene bags and stored at room temperature for laboratory analysis.
Water sample collection and preparation: Water samples were collected from 3 different sites along the river course using depth integrated water sampling method at 10 cm, 20 cm and 30 cm depths, mixed together to produce a composite sample. From this a 500 ml representative sample was then collected in white plastic bottles according to standard procedures.
Heavy metal concentration determination: Heavy metal concentration determination was carried out using X- ray fluorescence spectroscopy (XRF) system where the following elements were quantified; V, Mn, Fe, Co, Ni, Cu, Zn, Hg and Pb. The results were expressed as milligrams per kilogram (mg/kg) of the dry matter in soils and as micro grams per liter (µg/l) in water.
Data Management and Analysis: The data was analyzed using Microsoft excel to get the mean and standard error of the mean which was then subjected to statistical tests of significance using ANOVA (p<0.05). The results that were found to be statistically different were subjected to a Tukeys post hoc analysis test.
RESULTS
Mean heavy metal concentrations in soils at the sampled sites: Table 1 below shows that the concentrations of vanadium, manganese, iron, and nickel and mercury were low upstream. The levels increased to maximum in the soils collected next to the dumpsite. The heavy metal content slightly lowered as indicated by the concentrations of the metals in the soil samples collected downstream.
Copper concentrations in the soil increased from a mean of 143.02 ±29.69 mg/kg upstream, to a high mean of 2089.61±67.44 mg/kg at the dumpsite; a distance of only 300m. However, further downstream this concentration slightly declined to 1665.89 ±53.79 mg/kg implying that the dumpsite is heavily contaminated owing to the waste. The concentrations of zinc, cobalt and lead levels remained constant across the three study sites.
Table 1: Mean heavy metal concentrations in soils obtained at the sampled sites
| Element | Upstream | Midstream mg/kg | Downstream |
|---|---|---|---|
| V | 337.05±77.30a | 5077.95 ± 208.97b | 4402.15±45.89b |
| Mn | 5490.60±1371.77a | 14419.10±254.73b | 13835.41±253.51b |
| Fe | 22.01±7.90a | 525.50±33.59b | 338.48±60.21b |
| Cu | 143.02±29.69a | 2089.61±67.44b | 1665.89±53.79c |
| Zn | 128.11±21.54a | 289.27±31.58a | 217.32±30.34a |
| Co | 2767.91±766.22a | 6003.90±121.05a | 5974.57±236.17a |
| Ni | 5250.62±1439.42a | 11968.76±255.87ab | 10954.29±124.60b |
| Hg | 7.43±1.41a | 436.70±67.88b | 171.24±35.15ab |
| Pb | 19.79±5.78a | 60.22±15.58a | 56.64±16.19a |
Mean heavy metal concentrations in water at the sampled sites: Samples of water were collected and analyzed to measure the impact of the dumpsite on water and the dilution effect. The results were compared with those of World Health Organization and European Union drinking water standards.[18-20] The results show that there was a general increase in mean heavy metal concentrations of manganese, iron, cobalt and zinc in the water samples collected from upstream to the samples collected midstream. The concentrations were then seen to decrease as the river flowed downstream away from the dumpsite (Table 2).
Table 2: Mean heavy metal levels in water samples collected from the study site
| Element | Upstream µg/l | Midstream | Downstream | WHO | EU |
|---|---|---|---|---|---|
| Mn | 366 ± 33a | 856 ± 93b | 496 ± 8d | 40050 | |
| Fe | 5132±259a | 12402 ± 1789b | 8906±1044d | 3000 | 200 |
| Co | 56 ± 3a | 125 ± 11b | 102 ± 32d | NG | |
| Cu | BDL | BDL | BDL | 2000 | 2000 |
| Zn | 40 ± 7a | 262 ± 8b | 336 ± 18d | 3000 | |
| Pb | BDL | BDL | BDL | 10 | 10 |
| Hg | BDL | BDL | BDL | 1 | 1 |
| V | BDL | BDL | BDL |
Within rows, means with different alphabets are statistically different at p<0.05 by ANOVA and Tukeys’ test.
BDL- Below detectable levels; NG- No guideline available
DISCUSSION
In this study the mean metal concentrations of iron in the soils ranged between 22.01 mg/kg to 525.50 mg/kg, which is within the ranges reported by [21] Other workers have reported higher values than those of this study, [22] reported values between 1100 to 10,920 mg/kg while [2] recorded a mean concentration of up to 57100 mg/kg on uncontaminated soil.
On the other hand iron levels in all water samples were higher than the 200 µg/l recommended by [20] in drinking water. The works of [23] revealed iron levels that were much lower than those of this study with values between 460 - 610 µg/l. In contrast, the studies of [24] recorded higher iron values ranging between 11 -21675 µg/l.
The natural range of zinc in soils according to [25] is between 10 – 300 mg/kg, and as shown in the results, the zinc concentration of soil in this study was within these natural ranges. These results also compare with those of several studies done by different workers, who reported values of zinc in different countries of between 133 mg/kg to 300 mg/kg, for uncontaminated soils.[2;26-28] [22] reported zinc levels in soils higher than those of this study ranging between 350-3052 mg/kg.
Zinc levels in the water samples collected from the three sites were below the 3000 µg/l recommended by World Health Organization[23] Reported zinc levels similar to those of this study with values ranging between 200 - 250 µg/l while[24] recorded zinc levels lower than those of this study.
The mean metal concentration of copper in the soils of this study ranged between 143.02 and 2089.61 mg/kg and apart from soils collected on the control site the other values were above those reported in literature for uncontaminated soils. [28] reported soils with the higher limits of 100 mg/kg for copper in uncontaminated soils while [22] recorded even higher levels of copper from 95 to 6726 mg/kg from soils collected from several dumpsites.
The permissible range for the concentration of manganese in soils is 200 - 9,000 mg/kg. [25] The soils analyzed in this study had a mean metal concentration ranging from 5490 - 14419 mg/kg. Studies carried out by [26-27] reported manganese values within the ranges similar to those of this study. However, other works have recorded lower levels than those of this study. [2;22;28]
The levels of manganese in the water samples collected at the control site were within the recommended 400 µg/l in drinking water by [19], but they were above the European Union recommendation of 50 µg/l. [23] recorded values in a similar range while [24] reported lower values of manganese in water samples.
The mean metal concentration of cobalt recorded from the soils in this study was high compared with values reported in literature. Though international standards for cobalt in drinking water are not available, other works have recorded values of cobalt in drinking water close to those found in this study. [29] recorded levels of cobalt in drinking water in the ranges of 2.6 - 107 µg/l while [23] reported cobalt levels higher than those of this study with values ranging from 370 - 530 µg/l.
The high levels of cobalt in the soil of this study could be attributed to indiscriminate disposal of cobalt containing wastes on the dumpsite as cobalt enters the air through burning of oil and cobalt containing compounds used in industries, trace element additives in agriculture and medicine. [30-31] After it enters the air, cobalt is then associated with particles which will eventually settle to the ground within few days.
Mean soil concentrations of vanadium found in the soils of this study ranged from 337 to 5077 mg/kg. [32] reported vanadium concentrations lower than those of this study in India while on the other hand, [33] reported values as high as 5340 mg/kg in South Africa.
Lead is one of the more persistent metals and is estimated to have a soil retention time of 150 to 5000 years.[34] This study reported a mean concentration level ranging from 19 to 60 mg/kg which is within ranges in soils studies by [35] who recorded a range of 15 to 311 mg/kg. However [22] reported very high levels of lead from soils collected from various dumpsites ranging between 3500-6860 mg/kg while [36] reported values of lead in soil at Ibadan ranging from 1340 - 1693 mg/kg.
The lead levels in soils could be attributed to the dumpsite and the busy Uthiru / Kawangare Road. This is because in the past lead was used in gasoline and hence a major contributor to lead in soil, and automotive exhaust emitted when gasoline contained lead. [37] found high levels of lead in both soil and couch grass grown along the road in Dar es Salaam. Lead is released into the air during burning of oil, or waste, it is then removed from the air by rain and by particles falling to land or into surface water. Once it falls onto soil, it sticks strongly to soil particles and remains in the upper layer of soil.[38]
Mercury levels in the soils analyzed for this study ranged from 7.43 - 436.70 mg/kg. Similar results were recorded by [2] who reported mercury levels of between 18.6 to 46.7 mg/kg in the studied soils.
CONCLUSIONS
The soils samples studied were found to have higher levels of vanadium, copper, cobalt, nickel, mercury, manganese and lead than is permissible for agricultural soils. On the other hand, the soils were found to be deficient in iron and zinc whose levels were lower than the permissible levels for agricultural soils. Analysis of water samples revealed that copper, vanadium, lead and mercury metals were below the detection limits while iron metal levels in all water samples were higher than the recommended values in drinking water. Manganese levels from the control site were within the recommended values World Health Organization but they were above the EU recommendations. While international standards for cobalt in drinking water are not available, other works have recorded values of cobalt in drinking water close to those found in this study. Zinc levels in all the sites were below the recommendations by World Health Organization.
It was found that the dumpsite indeed directly contributed to the pollution of soils and the nearby fresh water source, because the metal concentrations from the soil samples was shown to increases at the dumpsite and decrease away from the dumpsite. Likewise, the water samples collected shown a similar pattern of increase of heavy metal concentration at the dumpsite and a decrease downstream away from the dumpsite.
ACKNOWLEDGEMENT
This research wishes to acknowledge Mr. Kangethe and Mrs. Lydia from the Ministry of Agriculture Dagorreti division who accompanied us as we collected the laboratory samples. Kenya Bureau of Standards (KEBS) and the Institute of Nuclear Science University of Nairobi for the analysis of heavy metals in the soil and water samples respectively. The PRIME_K PROJECT, Grant No: IR24TW008889 which gave some authors of this manuscript some tips in manuscript writing.
REFERENCES
- UNDP . Practical Action. Technology Challenging Poverty. United Nation Development Programme Report, 2006.
- Kimani, N.G. Implications of the Dandora municipal dumping site in Nairobi, Kenya. Environmental pollution and impacts on public health. kenya: United Nations Environment Programme, 2007.
- Wong CSC, Li XD, Zhang G, Qi SH, and Peng XZ. Atmospheric depositions of heavy metals in the Pearl River Delta, China. Atmos. Environ, 2003; 37, 767-776.
- Yusuf AA, Arowolo TA, and Bamgbose O. Cadmium, Copper and Nickel levels in vegetables from industrial and residential areas of Lagos City, Nigerian. Food. Chem Toxicol, 2003; 41, 285-291.
- Oyelola O, Babatunde AI,and Odunlade AK. Health implications of solid waste disposal: case study of Olusosun dumpsite, Lagos, Nigeria. International Journal of Pure and Applied Sciences, 2009; 3, 1-8.
- Okoronkwo NE, Igwe JC, and Onwuchekwe EC. Risk and health implication of polluted soils for crops production. Afr. J. Biotechnol, 2005; 4(13), 1521-1524.
- Okoronkwo NE, Odemelam SA, and Ano OA. Levels of toxic elements in soils of abandoned waste dumpsite. African Journal of Biotechnology, 2006; 5, 1241-1244.
- Bilos C, Colombo JC, Skorupka CN, and Rodriquez Presa M.J. Source distribution and variability of airbone trace metals in La plata City area , Argentina. Environ. Pollut, 2001;111,(91):149-158.
- Ejaz-Ul I, Xiao-E Y, Zhen-Li H, and Mahmood, Q. Assessing potential dietary toxicity of heavy metals in selected vegetables and food crops. J. Zhejiang Univ Scie B, 2007;8(1): 1-13.
- Ellias DR, and Salt DE. Plants, selenium and human health. Curr Opin Plant Biol, 2003; 53(3), 273-279.
- Pillay AE, Williams JR, Al-Lawati MO, Al-Hadabbi SMH, Al-Hamdi MH, and Al-Hamdi A. Risk assessment of chromium and arsenic in date palm leaves used as livestock feed. Environ. Int, 2003;29(5), 541-545.
- Bahemuka TE, and Mubofu EB. Heavy metals in edible green vegetables grown along the sites of the Sinza and Msimbazi rivers in Dares Salaam, Tanzania. Food Chem, 1999; 66 (1), 63-66.
- Arora M, Kiran B, Rani , Rani A, Kaur B,and Mittal N. Heavy metal accumulation in vegetables irrigated with water from different sources. Food Chem, 2008;111(4), 811-815.
- Karatas M, Dursun S, Guler E, Ozdemir C, and Argun ME. Heavy metal accumulation in wheat plants irrigated by waste water. Cell. Chem Tech, 2006; 40(7), 575-579.
- Oluyemi EA, Feuyit G, Oyekunle JAO, and Ogunfowokan OA. Seasonal variations in heavy metal concentrations in soil and some selected crops at a landfill in Nigeria. Afr. J. Environ. Sci. Technol, 2008; 2, 89-96.
- Harmanescu M, Alda LM, Bordean DM, Gogoasa I, and Gergen I. Heavy metals health risk assessment for population via consumption of vegetables grown in old mining area; a case study: Banat County, Romania. Chem. Cent. J, 2011; 5, 64.
- Melville GJ, and Welsh AH. Line transect sampling in small regions. Biometrics, 2001; 57, 1130-1137.
- WHO. Guidelines for Drinking Water Quality. 3rd ed. Geneva, 515: World Health Organization. WHO, 2004.
- WHO. WHO's Guidelines for Drinking-water Quality. Geneva, World Health Organization, 1993
- EU. Council Directive 98/83/EC on the quality of water intented for human consumption. European Union, 1998.
- Akubugwo EI, Obasi A, Chinyere GC, Eze E, Nwokeoji O, and Ugbogu E A. Phytoaccumulation effects of Amaranthus hybridus L grown on Buwaya refuse dumpsites in Chikun, Nigeria on heavy metals. J. Bio &. Env. Scie, 2012; 2(5): 10-17.
- Awokunmi EE, Asaolu SS, and Ipinmoroti K. Effect of leaching on heavy metals concentration of soil in some dumpsites. Afr. J. Environ. Sci. Technol, 2010; 4(8), 495- 499.
- Raji M I O, Ibrahim YKE, and Ehinmidu JO. Physicochemical characteristics and Heavy metal levels in Drinking Water sources in Sokoto metropolis in North-western Nigeria. J. Appl. Sci. Environ Manag, 2010;14(3) 81-85.
- Laniyan TA, Kehinde- Phillips OO, and Elesha L. Hazards of heavy metal contamination on the groundwater around a municipal dumpsite in Lagos, Southwestern Nigeria. International Journal of Engineering & Technology, 2011; 11(5) 61-69.
- Eddy NO, Odoemelem SA, and Mbaba A. Elemental composition of soil in some dumpsites. J. Envr. Agric & Food Chem, 2006; 5(3) 1349-1365.
- Kabata-Pendias A and Pendias H. 1992. Trace elements in soils and plants. 2nd edition. CRC press. Boca Raton. FL . 1992; 159-194.
- Haluschak P, Eilers RG, Mills GF and Grift S. Status of selected trace elements in agricultural soils of Southern Manitoba. Technical Report 1998-6E Land Resource Unit, Brandon Research Centre, Research Branch, Agriculture and Agri-Food Canada, 1998.
- McGrath SP, Zhao FJ, and Lombi E. Plant and rhizosphere process involved in phytoremediation of metal-contaminated soils. Plant Soil, 2001; 232 (1/2), 207–214.
- Meranger JC, Subramanian KS and Chalifoux C. Metals and other elements: Survey for cadmium, cobalt, chromium, copper, nickel, lead, zinc, calcium, and magnesium in Canadian drinking water supplies. J. Assoc. Off Anal Chem, 1981; 64, 44-53.
- ATSDR . Toxicology Profile for Cobalt. Atlanta, Georgia, United States. US Department of Health and Human Services. Agency for Toxic Substances and Disease Registry. 2004.
- Nagpal NK. Technical Report, water quality guidelines for cobalt. Water quality standards. British Columbia. Ministry of Water, Land and Air Protection, 6, 2004.
- Krishna AK and Govil PK. Soil contamination due to heavy metals from an industrial area of Surat, Gujarat, Western India. Environ. Monit. Asses, 2007;124, 263-275.
- Molatlhegi RO. Determination of vanadium (V) in soil and plants using electrothermal Atomic Absorption Spectrometry. Magister Technologiae: Chemistry, Tshwane University of Technology, 2005
- Sobolev D and Begonia MFT. Effects of heavy metal contamination upon soil microbes: lead-induced changes in general and denitrifying microbial communities as evidenced by molecular markers. Int. J Environ. Res Public Health, 2008;5(5), 451.
- Premarathna HMPL, Hettiarachchi GM, and Indraratne SP. Trace metal concentration in crops and soils collected from intensively cultivated areas of Sri Lanka. Pedologist, 2011;54(3), 230-240.
- Aluko OO, Sridha MKC, and Oluwande PA. Characterization of leachates from a municipal solid waste landfill site in Ibadan, Nigeria. J. Environ. Health Research, 2003; 2 (1) 32-37.
- Luilo GB and Othman OC. Lead pollution in urban roadside environments of Dar es Salaam city. Tanz. J. Sci, 2006; 32, 61-67.
- ATSDR. Toxicology profile for Lead. Atlanta, Georgia, United States. US Department of Health and Human Services. Agency for Toxic Substances and Disease Registry. 2007.
| International Journal of Life-Sciences Scientific Research (IJLSSR)
Open Access Policy
Authors/Contributors are responsible for originality, contents, correct
references, and ethical issues.
IJLSSR publishes all articles under Creative Commons
Attribution- Non-Commercial 4.0 International License (CC BY-NC). https://creativecommons.org/licenses/by-nc/4.0/legalcode |