INTRODUCTION- A perfect
woman, we can see, is a working woman, not a worthless, not a fine lady, but
one who uses her hands, mind, and heart for the good of others-Thomas Hardy.
India is by
tradition and is found in diverse religions, traditions, cultures, and customs.
Women's position in India usually pertains to the home and is limited to their
problems.[1] Then the Female labor act intensified in several
industries, embracing health, imparting knowledge, fabric and material, and
community work.[2] As globalization and industrialization started,
women were encouraged to be educated and work as their wish.[3]
“Stress” is
derived from the Latin word, “Stringere” means to
hold “tight”.[4] Stress is defined by “The Oxford Dictionary of
Psychology" as a state of mental or emotional strain resulting from
adverse or demanding circumstances and generated by the overall state of health
or fitness and experiences that are hard to handle.[5] In Indian
society, women have to work only in their homes and look after their offspring
and family.[6] Then, Stress can harm an individual’s life, attitude
toward a beloved one, and health condition.[7]
Nowadays,
women play a dual role as a housewife and working women.[8] So, the
family sometimes does not support a woman to leave the household work and go to
an office.[9]
How the individual deals with
stressful situations are known as 'coping’.[10] Coping
strategies are behaviours adopted by an individual as
a response to reducing the side effects of the stressors. Therefore, being a
housewife or working woman may depend on their economic status, accessibility
to work, children's age, support from their partner, desire for work,
knowledge, and wellness.[11]
MATERIALS AND METHODS
Study design- A non-experimental descriptive
design.
Study Population- The sample comprises subjects
selected from the accessible population. The present study sample comprised
working and non-working women in selected areas of Bagalkot, India.
Data Collection Procedure- A Non-experimental design was
adopted for the study. The area has been selected by convenient sampling
technique, and the sample has been selected with the help of the Purposive
sampling technique. The present study was conducted in different organizations
and homes of Bagalkot, Vidyagiri, and Navanagar,
areas of Bagalkot. Participants: The study sample size is 100, with (n1=
50) working women and (n2= 50) non-working women between 20-55
years. The present study data were collected between 9 am to 4 pm, depending
upon the availability of subjects. The data collection period was from 19-
07-2022 to 31-07-2022.
Statistical Analysis- The data
was analyzed by using SPSS 18 statistical package. The data obtained from the
sample was organized and summarized with the help of descriptive statistics
like mean and SD. Calculating mean, standard deviation, mean standard error,
't'-test of Stress and level of cope. Application of chi-square test to find
the association between socio-demographic variables with stress scores of
working and non-working women.
Ethical Consideration- Ethical
clearance certificate was obtained from Shri B.V.V.S Sajjalashree
Institute of Nursing Sciences, the institutional ethical committee. Written
Consent was obtained from each participant.
RESULTS- Percentage-wise distribution of
working women according to their age group reveals that most working women
(40%) belong to the age group 41-45 years. 96% of them work in urban areas. 66%
of working women residing in Bagalkot. 64% of them belong to the Hindu
religion. 54% of them had graduated and above. 96% of working women are
married. 40% are with 30,001 and above family monthly income. 60% belongs to
the nuclear family. 52% of them with 6-10 years of working experience. 62% with
five and above family members. 60% have 0-2 children. Percentage-wise
distribution of non-working women according to their age group reveals that
most non-working women (40%) belong to the age group 41-45 years. 52% of
non-working women residing in Bagalkot. 60% of them belong to the Hindu
religion. 34% of them had higher secondary. 94% of non-working women are
married. 40% are with 20,001-30,000 family monthly income. 62% belong to the
nuclear family. 58% with five and above family members. 50% have 0-2 children
(Table 1).
Table 1:
Distribution of working and non-working women according to their
Sociodemographic characteristics
|
Socio-Demographic factors |
Score |
Character |
Working women (N1=50) |
Non-working women (N2=50) |
|||
|
F |
Percentage (%) |
F |
Percentage (%) |
||||
|
1 |
Age in years |
1 |
20-30 |
14 |
28 |
11 |
22 |
|
2 |
31-40 |
16 |
32 |
19 |
38 |
||
|
3 |
41-55 |
20 |
40 |
20 |
40 |
||
|
2 |
Place of working |
1 |
Rural |
2 |
4 |
0 |
0 |
|
2 |
Urban |
48 |
96 |
0 |
0 |
||
|
3 |
Place of residency |
1 |
Bagalkot |
33 |
66 |
26 |
52 |
|
2 |
Navanagar |
10 |
20 |
24 |
48 |
||
|
3 |
Vidyagiri |
7 |
14 |
0 |
0 |
||
|
4 |
Religion |
1 |
Hindu |
32 |
64 |
30 |
60 |
|
2 |
Muslim |
7 |
14 |
11 |
22 |
||
|
3 |
Christian |
8 |
16 |
5 |
10 |
||
|
4 |
Others |
3 |
6 |
4 |
8 |
||
|
5 |
Educational status |
1 |
No formal education |
1 |
2 |
7 |
14 |
|
2 |
Primary |
5 |
10 |
12 |
24 |
||
|
3 |
Higher Secondary |
17 |
34 |
17 |
34 |
||
|
4 |
Graduation and above |
27 |
54 |
14 |
28 |
||
|
6 |
Marital status |
1 |
Married |
48 |
96 |
47 |
94 |
|
2 |
Unmarried |
2 |
4 |
3 |
6 |
||
|
7 |
Family monthly income |
1 |
0-10,000rs |
6 |
12 |
4 |
8 |
|
2 |
10,001-20,000rs |
12 |
24% |
11 |
22 |
||
|
3 |
20,001-30,000rs |
12 |
24 |
20 |
40 |
||
|
4 |
30,001rs and above |
20 |
40 |
15 |
30 |
||
|
8 |
Type of Family |
1 |
Joint Family |
20 |
40 |
19 |
38 |
|
2 |
Nuclear Family |
30 |
60 |
31 |
62 |
||
|
9 |
Years of Experience with working women |
1 |
1month-5years |
10 |
20 |
0 |
0 |
|
2 |
6-10years |
26 |
52 |
0 |
0 |
||
|
3 |
11-15years |
9 |
18 |
0 |
0 |
||
|
4 |
16 and above |
5 |
10 |
0 |
0 |
||
|
10 |
Total number of family members |
1 |
Two |
0 |
0 |
0 |
0 |
|
2 |
Three |
3 |
6% |
3 |
6 |
||
|
3 |
Four |
16 |
32 |
18 |
36 |
||
|
4 |
Five and above |
31 |
62 |
29 |
58 |
||
|
11 |
Total number of children |
1 |
0-1 |
30 |
60 |
25 |
50 |
|
2 |
03-5 |
20 |
40 |
25 |
50 |
||
The comparison of the level of
Stress among working and non-working women reveals that most non-working women
(98%) had moderate Stress, (2%) of them had high Stress and there was no
low-level stress, whereas in working women majority of them had (94%) moderate
Stress, (4%) had high Stress, and (2%) had low levels of Stress. (Table 2, Fig.
1).
Table 2: Comparison between Levels of
Stress among both women
|
S. No. |
Level of Stress |
Non-working women (%) |
Working women (%) |
|
1 |
Low level |
00(0) |
1(2) |
|
2 |
Moderate level |
49(98) |
47(94) |
|
3 |
High perceived Stress |
01(2) |
02(4) |
|
|
Total |
50(100) |
50(100) |
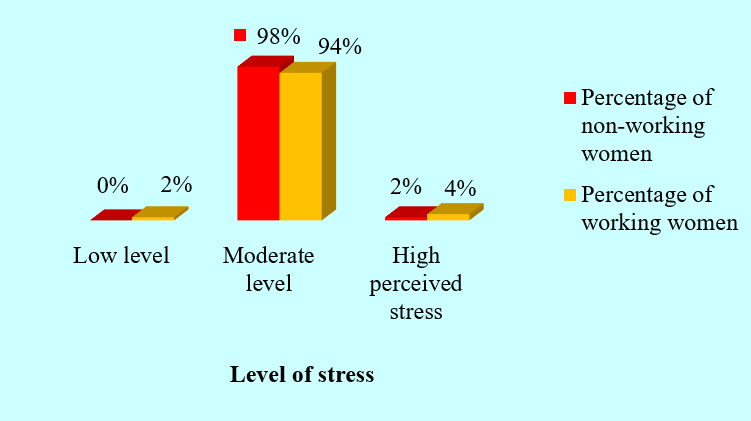
Fig 1: 3D Clustered column
chart depicts the percentage-wise total no of children of working and
non-working women
The comparison of the level of
coping among working and non-working women reveals that most of the non-working
women (94%) had good cope, no very good cope, and (6%) had average cope. There
was no poor cope, whereas working women majority of them had (88%) good cope,
(2%) had very good cope, (4%) of them had average cope, and (2%) had a poor
level of coping (Table 3).
Table 3:
Percentage wise distribution of working women by comparing with the cope level
of working and non-working women
|
S. No. |
Level of cope |
Working women (%) |
Non-working women (%) |
|
No. of Score |
No. of score |
||
|
1 |
Very good |
1(2) |
0(0) |
|
2 |
Good |
44(88) |
47(94) |
|
3 |
Average |
2(4) |
3(6) |
|
4 |
Poor cope |
1(2) |
0(0) |
|
|
Total |
50(100) |
50(100) |
In Table 4, the
calculated chi-square value is 7.04 less than the table value 5.9, there is a
significant association between place of residency and Stress of non-working
women and remaining are more than the table value so, there is no significant
difference between age, religion, educational status, marital status, family
monthly income, type of family, total number of family members, total number of
children.
Table 4: Association of the stress scores
of non-working women with their socio-demographic variable
|
S. No |
Socio-demographic variables |
Df |
Chi-square value |
Table value |
Significance |
|
|
1 |
Age |
2 |
1.675 |
5.991 |
p<0.05 |
|
|
2 |
Place
of residency |
2 |
7.04 |
5.991 |
p<0.05 |
|
|
3 |
Religion |
4 |
6.021 |
9.488 |
p<0.05 |
|
|
4 |
Educational
status |
4 |
0.837 |
9.488 |
p<0.05 |
|
|
5 |
Marital
status |
2 |
1.809 |
5.991 |
p<0.05 |
|
|
6 |
Family
monthly income |
4 |
1.915 |
9.488 |
p<0.05 |
|
|
7 |
Type
of family |
2 |
0.225 |
5.991 |
p<0.05 |
|
|
8 |
Total
number of family members |
3 |
2.774 |
7.815 |
p<0.05 |
|
|
9 |
Total
number of children |
5 |
7.548 |
11.07 |
p<0.05 No |
p≤0.05;
Two-tailed= No Significant
Calculated chi-square value is
(9.620) less than the table value (9.488) so, there is a significant
association between the total number of children and the Stress of working
women and remaining are more than the table value so there is no significant
association between age, place of residency, religion, educational status,
marital status, family monthly income, type of family, total family members,
total number of children with Stress of working women (Table 5).
Table 5: Association
of the stress scores of working women with their socio-demographic variable
|
S. No |
Socio-demographic variables |
Df |
Chi-square value |
Table value |
Significance |
|
|
|
1 |
Age |
4 |
0.149 |
9.488 |
p<0.05 |
||
|
2 |
Place of residency |
2 |
2.443 |
5.991 |
p<0.05 |
||
|
3 |
Religion |
3 |
0.601 |
7.815 |
p<0.05 |
||
|
4 |
Educational status |
3 |
3.366 |
7.815 |
p<0.05 |
||
|
5 |
Marital status |
1 |
0.12 |
3.841 |
p<0.05 |
||
|
6 |
Family monthly income |
3 |
4.533 |
7.815 |
p<0.05 |
||
|
7 |
Type of family |
1 |
3.00 |
3.841 |
p<0.05 |
||
|
8 |
Total number of family
members |
2 |
4.056 |
5.991 |
p<0.05 |
||
|
9 |
Total number of
children |
4 |
9.620 |
9.488 |
p≤0.05 |
p≤0.05;
Two-tailed= No Significant
Findings depict a comparison of
Stress and coping among working and non-working women. Stress among working
women was 20.66±3.2 and S.E.M. 0.45. In non-working women was 19.76±2.43 and
S.E.M. of Stress was 0.34. Coping among working women 63.3±8.43 and S.E.M.1.19.
In non-working women 61.58±5.98, S.E.M. of 0.84 (Table 6).
Table 6: Comparison of Stress and coping
among working and non-working women
|
|
|
Mean |
Std. Deviation |
Std. Error Mean |
|
|
Stress among working women |
20.66 |
3.2 |
0.45 |
|
Stress among non-working women |
19.76 |
2.43 |
0.34 |
|
|
|
Coping among working women |
63.3 |
8.43 |
1.19 |
|
|
Coping among non-working women |
61.58 |
5.98 |
0.84 |
Here the calculated t value is 1.571 which is less than the table
‘t’ value 1.645 at a 5% level of significance and mean is 0.9, standard mean is
4.05, standard error mean is 0.57, degree of freedom is 49 for 95% level of
confidence is at lower limit -0.25 and at upper limit is 2.05. Hence there is
no significance at 0.05 (Table 7).
Table 7: Comparing Stress among working and non-working women with ‘t-test
|
Mean |
S. D |
S.E.M. |
95% Confidence |
“t” value |
Table value |
df |
Significance |
|
|
Lower |
Upper |
|||||||
|
0.9 |
4.05 |
0.57 |
-0.25 |
2.05 |
1.571 |
1.645 |
49 |
No Significant |
p≤0.05 Two-tailed, α=0.05
The calculated t value is 1.186
which is more than the table t value (1.645) at a 5% level of significance and
mean is 1.72, standard mean is 10.25, standard error mean is 1.45, degree of
freedom is 49 for 95% of level of confidence for lower limit it is -1.19 and
upper limit is 4.63. Hence there is no significance at 0.05 (Table 8).
Table 8: Comparing Coping among working women and nonworking women with ‘t-test
|
Mean |
S. D |
S.E.M. |
95% Confidence |
“t” value |
Table value |
df |
Significance |
|
|
Lower |
Upper |
|||||||
|
1.72 |
10.25 |
1.45 |
-1.19 |
4.63 |
1.186 |
1.645 |
49 |
Significant association |
DISCUSSION- In the present study, a sample consists of 100 in the age
group 20-55 years, with (n1= 50) working women as 20-30 years as
(28%), 30-40 years as (32%), and 41-45 years (40%). Similarly, (n2=
50) non-working women are as 20-30 years as (22%), 30-40 years (38%), and 41-45
years (40%) by using a purposive sampling technique. One study was conducted by
Kamala et al. [12] with a sample of 50 in the age group 25-35
years in working women 25-30 years (46%) and 31-35years (54%) similarly in
nonworking women 25-30 years (38%) and 31-35years (62%) was selected randomly.
The study result shows that in working women, 114.2±25.23, non-working women,
106.4±33.56, and the ‘t’ value is 4.35.
In the
present study, many working women, according to their place of work, reveal
that out of 50 working women, the highest percentage (96%) work in the urban
area and (4%) in rural areas. Similarly, a
non-experimental study by Mohanasundhari et al. [13]
reveals that
with the highest percentage (92%) of work in the urban area and (8%) of work in
rural areas, the mean and SD of Stress was
79.37±25.201. In employed women, the mean and S.D 51.90±17.229 and the
calculated paired “t” value of t=11.29 were statistically significant at
p<0.001.
The study working and non-working shows
percentage-wise based on their marital status reveals that in 50 working women,
48(96%) were married, and 2(4%) were unmarried. In 50 non-working women 47(94%)
were married, 3(6%) were unmarried. Similarly, a cross-sectional study was
conducted by Devi et al. [14]. Total, 50 working women,
24(48%) was married, 26(52%) were unmarried. In 50 nonworking women 37(74%)
were married, 13(26%) were unmarried. The result showed that nonworking women
reported high-stress levels than working women (14.1% vs. 4.1%, p=.001).
Working women reported more use of informational support and venting to cope
with Stress than nonworking women (94.0% vs 88.1%, p=.001).
Findings related to stress level among working and non-working women in 50
non-working women reveals that most of the non-working women (98%) had moderate
Stress, (2%) of them had high Stress, and there no low-level stress, similarly
in 50 working women majority of them had (94%) moderate Stress, (4%) had high
Stress and (2%) low-level Stress. A Study was conducted by Bani et al. [15].
The result showed that most of the non-working women (90%) had moderate Stress,
(2%) high Stress, (8%) low-level stress. Of working women (84%) had moderate
Stress, (4%) had high Stress, (and 12%) had low levels of Stress.
The present
study percentage-wise depicts that place of residency reveals that among 50
working women, 66% were residing in Bagalkot, 20% were in Navanagar, remaining
14% in Vidyagiri. Of non-working women, 52% were
residing in Bagalkot, 48% were in Navanagar, remaining no one at Vidyagiri conducted at homes and organizations of Bagalkot.
The result showed that the Stress was 19.76±2.42 among non-working women.
Similarly, a
comparative study was conducted by Joseph et al. [16]. It
reveals that place of residency in percentage reveals that among 30 working
women, 56% were residing in rural, 44% were in urban, and for 30 non-working
women, 45% were in rural, and 55% were in urban. The result showed that the Stress
was 104.5±6.65 for working and 145.83±8.76 for non-working women. The
calculated ‘t’ value was 20.57, which is significant at p<0.001.
The present
study was a sample of 100 (50) working (50) non-working women between 20-55 yr.
Selected by using the purposive sampling technique. The study shows a significant association between the place of
residency and Stress of non-working women (χ2=7.04)
p<0.05. Similarly, a non-experimental study was conducted by Kanta et al. [17]. A Convenient sampling
technique was used in 500 women, n1=250 and n2=250 were selected. The
association between stress level and place of residency revealed a significant
association among working women and a nonsignificant association among
nonworking women. In working women, place of residency and stress levels has a
significant association. Then the calculated value is (ᵡ2 =49.56) more
than the table value (21.03) at a 0.05% significance level. The calculated
value is (χ2=20.51),
which is more than the tabled value (16.92) at a 0.05% level of significance.
The study concluded that place of residency and stress levels are significantly
associated.
In the
present study (50) working women family monthly income reveal that (12%) belong
to 0-10,000 and (24%) belong to 10,001-20,000 and (24%) belong to
20,001-30,000, and (40%) belong to 30,001 and above. Of 50 non-working women
(8%) belong to 10,001-20,000 and (22%) belong to 20,001-30,000, and (30%)
belong to 30,001 and above. A study was conducted by Vyas et al. [18].
A quantitative descriptive and by random sampling technique, 120 (60) working
(60) nonworking women. A stress scale questionnaire was used to collect data
and analyzed by mean, standard deviation, and F tests. There is a significant
difference among women with several children concerning their conditions. The
study concluded with stress levels ('t'= 6.23, p<0.01) in working women
8.61±3.12, and nonworking women 5.21±2.85.
A
comparative study was conducted by Dubey et al. [19]. A
sample of 100 women, 50 working and 50 non-working, were selected randomly,
aged between 25-40 years. The result showed that the working women were 91.28
±12.3, and non-working women were 84.24±10.26. The value of ‘t’ is 2.21 at 0.05
l.o.s. The study concluded that a significant association was found between the place
of residency and Stress of non-working women (χ2=6.04)
p<0.05. A present study assessing the stress level between working
and non-working women in 50 non-working women reveals that most non-working
women (98%) had moderate Stress, (2%) of them had high Stress. There was no
low-level stress. Similarly, of 50 working women majority of them had (94%)
moderate Stress, (4%) high Stress, and (2%) low-level Stress.
Similarly, a
study was conducted by Sultanpur et al. [20] on stress levels
between housewives and employed women, 100 women and 50 employed 50 Housewives
at Kalaburagi. Then it concluded that Stress in working women (62%) was mild,
hypercritical (22%) moderate (16%). In non-working women (44%) moderate (40%)
mild, (16%) severe. The study concluded that mild Stress was more among
non-working women, and severe levels in both were the same at 16%. The
calculation shows the relationship between working and nonworking women’s
stress levels with 0.05.
The present
study has been distributed based on their type of family as a sample of 100
(50) working 40% belong to joint family and 60% belong to nuclear family. Of
(50) non-working women 38% belong to joint family and 62% belong to nuclear family.
The study shows that the Stress of working women is 20.66±3.2, S.E.M 0.45.
Stress among non-working women was 19.76±2.43, S.E.M 0.34, ‘t’ value (1.571) at
a 5% significance level and DF is 49.
A
comparative study was conducted by Harilal et al. [21] on
stress levels among working women and housewives concerning the state of
Kerala. Data were collected from 180 respondents, 90 homemakers, and 90
employed women with the probability technique. Percentage-wise distribution of
type of house is 45% belong to joint family and 55% belong to the nuclear
family of homemakers. Similarly, 36% belong to a joint family and 64% belong to
the nuclear family of employed women. The study showed a relationship between
the stress levels of working women and housewives t value of 0.969 (p>0.05).
The study showed that a significant difference between Stress and stress level
was higher in working women than non-working women.
The present
study reveals the percentage-wise distribution of 50 working women based on
their years of experience of working women in selected areas of Bagalkot. It
shows that 20% with 1 month-5 years, 52% with 6 years-10 years, 18% with 11
years-15 years, and 10% with 16 and above were experienced. Similarly, in a
study conducted by Chore et al. [22], a
non-experimental descriptive comparative research design was used. The
selection of subjects with non-probability was 120 (60 working, 60 nonworking
women). The study result showed that 85% of the working women had severe
Stress, 15% had moderate Stress, and 35% of the nonworking women severe 65% had
moderate, with average Stress of 22.5, which was 26.2 in unemployed women
p<0.05. The study concluded that the stress level among working is
significantly more than that in non-working women.
CONCLUSIONS- The present study concluded that after obtaining
all the results, the researcher noticed higher perceived Stress among working
women than non-working women.
Further
studies are required to know the stresses and methods of coping for working and
non-working women, how to improve coping levels, and how to avoid Stress.
CONTRIBUTION OF AUTHORS
Research Concept - Rajeshwari Tippanna
Ghattennavar, Renukaraj Yallappa Nagammanavar
Research Design- Rajeshwari Tippanna
Ghattennavar, Renukaraj Yallappa Nagammanavar
Supervision- Rajeshwari Tippanna Ghattennavar, Deelip Somaninga Natekar
Data Collection- Rajeshwari Tippanna
Ghattennavar.
Data Analysis and Interpretation- Rajeshwari Tippanna
Ghattennavar
Literature Search- Rajeshwari Tippanna
Ghattennavar
Writing Article- Rajeshwari Tippanna
Ghattennavar
Critical Review- Renukaraj
Yallappa Nagammanavar,
Deelip Somaninga Natekar
Article Editing- Rajeshwari Tippanna
Ghattennavar, Renukaraj Yallappa Nagammanavar, Deelip Somaninga Natekar
Final Approval- Renukaraj Yallappa
Nagammanavar, Deelip Somaninga
Natekar
REFERENCES
- Yellen
JL. net. The history of women’s work and wages and how it has created
success for us all. [Updated 2021; May 12; Cited 2021 Jul 24]. Available
at
https://www.brookings.edu/essay/the-history-of-womens-work-and-wages-and-how-it-has-created-success-for-us-all/.
- Chapman
T, Mishra V. net. Rewriting the Rules: Women and Work in India. [Updated
2021 May 10; Cited 2021 Jul 2023]. Available at https://www.orfonline.org/research/rewriting-the-rules-women-and-work-in-india.
3.
Bhardwaj VK.
Level of Stress among Working and non-working women about Healthliness,
well-being, and Depression: A Comparative study. IJCRT 2018; 5(3): 1884-90.
4.
Ghosh S.
Stress: Working and non-working women. Inter J Appl Res., 2020; 6(3): 375-77.
5.
Shukla S,
Jaiswal M, Agrahari K, Shingh A. A study on stress
levels among working and nonworking women. Inter J Home Sci., 2017; 3(1):
349-57.
6.
Maheshwari P.
Occupational Stress in Working Women: Its Relationship with their Level of
Emotional Intelligence and the Coping Strategies Used to Deal with Stress.
Inter J Cross-Discipl Subj Educ, 2013; 3(2): 1441-46.
doi: 10.20533/ijcdse.2042.6364.2013.0201.
7.
Shristi T. A
comparative study to assess the level of Stress and coping strategies among
married working and non-working women residing in selected urban areas of
Dehradun, Uttarakhand. JMSCR, 2019; 7(11): 989-95. doi:
10.18535/jmscr/v7i11.171.
8.
Nazir A. To
compare the level of Stress among working and non-working women in Srinagar. J
Res Humanities Soc Sci., 2021; 9(3): 47-52.
9.
Neeru G.
Occupational Stress and Challenges Faced by Working Women in India. - Ind J
Res., 2014; 3(7): 1-3.
10. Dhurandher D, Janghel G. Coping Strategy of Stress
in Employed Women and Non-Employed Women. Int J Sci Res., 2015; 5(4): 1-3.
11. Shueh YL, Cai LT. Work Stress, Coping Strategies, and Resilience:
A Study among Working Females. Asian Soc Sci., 2014: 10. doi:
10.5539/ass.v10n12p41.
12. Kamala DB. Stress Management: A Comparative Study of Working and
Non-Working Women. 2020 September 30th; 9(3): 22-26.
13. Mohanasundhari SK. A Comparative Study to assess the level of Stress between
working and nonworking women in Sir Ivan Stedeford
Hospital at Ambattur. 2018; 7(4): 573-76. doi:
10.5958/2349-2996.2017.00111.2.
14. Devi SS. A quasi-experimental study to evaluate the effectiveness
of pranayama on Stress and coping among housewives in selected community areas,
in Pudukkottai. 2018; pp. 1-37.
15. Bani IW, RN, Radwan H, Shujairi, Arwa
Al, Hijazi H, et al. Salivary cortisol, perceived Stress, and coping
strategies: A comparative study of working and non-working women. J Nurs Manag., 2022; 30(3): 3553-67. doi:
10.2147/jmdh.s229396.
16. Joseph JK. A comparative study to assess the level of Stress among
working and non-working women. Int J Recent Sci Res., 2019; 10(04): 32094-97.
doi:10.24327/ijrsr.2019.1004.3397.
17. Kanta D. Level of stress among working and non-working women in
Chandigarh. Int J Sci Eng Res., 2016; 7(4) 1086-88.
18. Vyas. R. Level of Anxiety, Depression, and Stress among Working
and Non-Working Women. Int J Indian Psychol., 2019; 7:801-06. doi:
10.25215/0703.087.
19. Dubey K. A comparative study on stress management of working and
non-working women with special reference to Rewa district. International
Journal of Advanced Academic Studies.2021; 3(3): 171-73.
20. Sultanpur NM. Stress level between housewives and employed women.
Int Educ Res J., 2019; 5(6): 20-23.
21. Harilal A, Santhosh VA. A comparative study on stress levels among
working women and housewives concerning the state of Kerala. NMIMS J Econ
Public Policy, 2017; II (1): 29-35. doi:
10.36106/gjra.
22. Chore SN. Assess the level of Stress among working and nonworking
women residing in selected areas in a view to developing an information
booklet. Sinhgad J Nur., 2020; X(I): 38-42. doi: 10.52711/2454-2652.2021.00085.